by mfe22 | Nov 22, 2025 | Visualization
You inhale 22,000 breaths a day. How clean are they?
Air pollution is invisible, yet it is one of the most harmful elements we are exposed to every day. A major contributor to this pollution is PM2.5 — fine particulate matter that measures 2.5 micrometres or smaller. These particles are small enough to reach deep into the lungs and enter the bloodstream, posing serious risks to heart and respiratory health. PM2.5 levels are measured in micrograms per cubic metre (µg/m³), the global standard for assessing air quality.
In this analysis, I explored how Lebanon compares to its neighbouring countries and to global regions from 2009 to 2019. The findings tell a decade-long story of stagnation and persistent pollution.
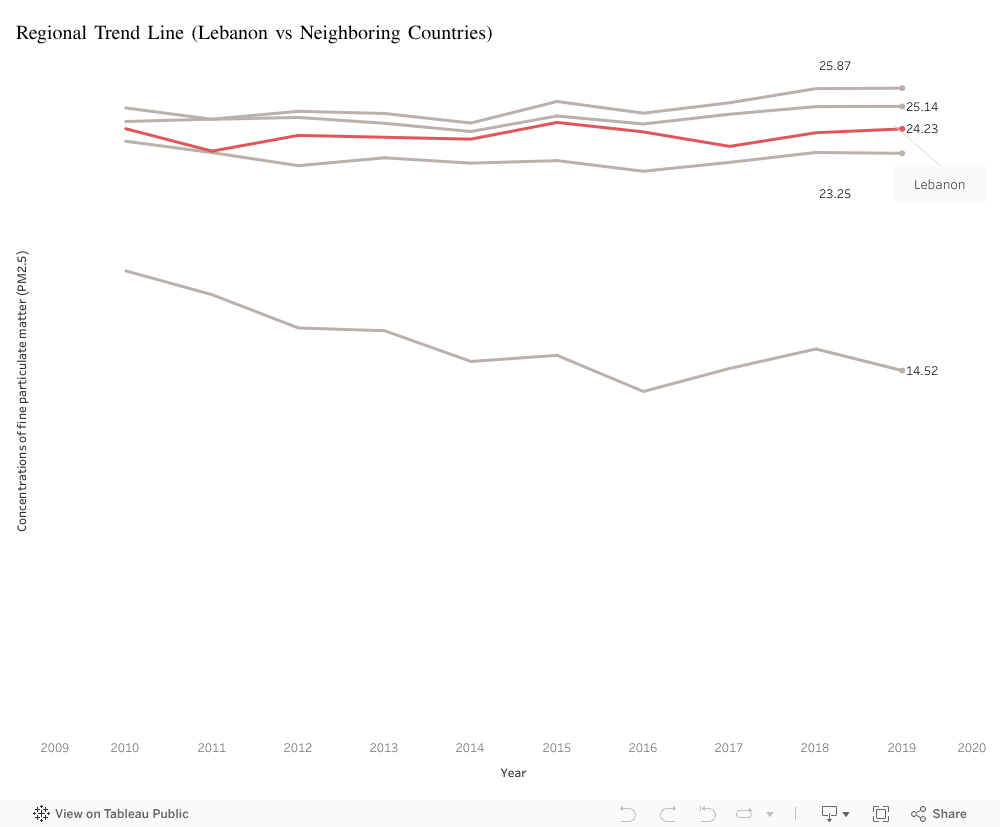
Lebanon vs its Neighbors: A Decade of Stagnation
Over the past decade, Lebanon’s PM2.5 concentration has fluctuated between 23 and 25 µg/m³. While these values place Lebanon below Syria and Turkey, they remain significantly above Cyprus, which consistently records some of the cleanest air in the region. Jordan, though varying slightly year to year, also remains well above safe limits.
Despite these differences, all five countries share one concerning trend: no noticeable improvement over ten years. Lebanon’s air has remained essentially unchanged, offering no signs of meaningful progress in pollution reduction.
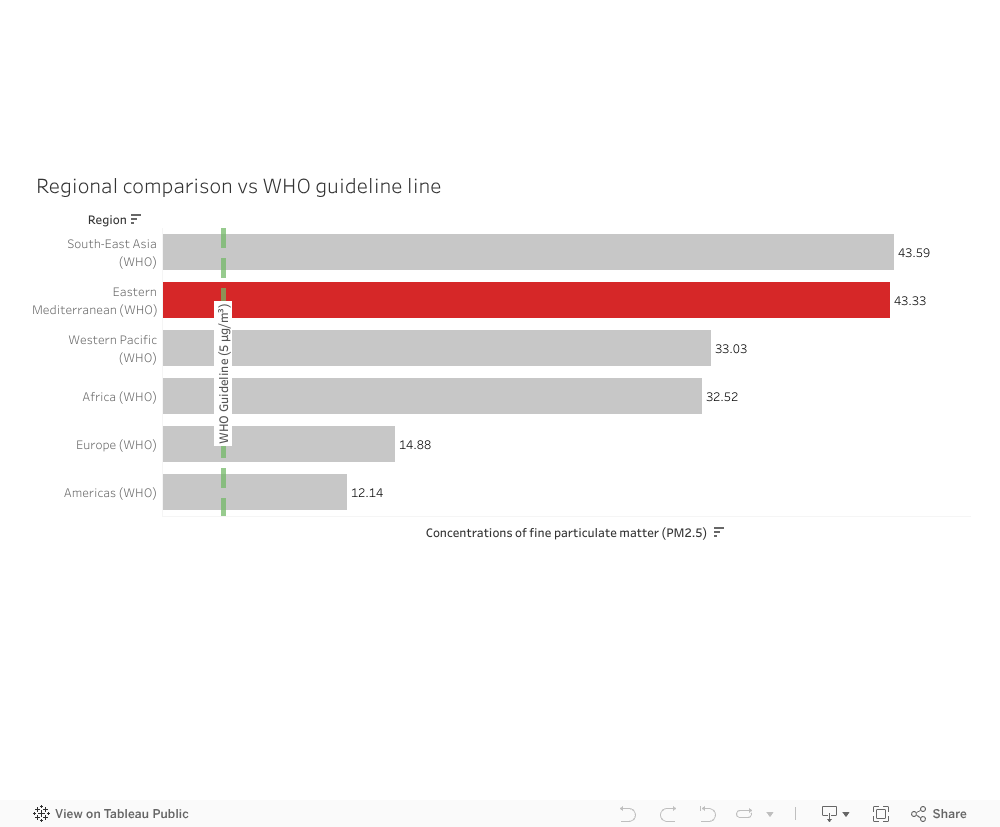
How the Middle East Compares to the World
When placing Lebanon’s situation into a broader context, a clearer imbalance emerges. The Eastern Mediterranean region, which includes Lebanon, records an average PM2.5 concentration of 43.33 µg/m³—almost nine times higher than the WHO annual guideline of 5 µg/m³. Only South-East Asia performs slightly worse.
Regions such as Europe and the Americas fall between 12 and 15 µg/m³, much closer to safer exposure levels. This highlights a stark contrast: the Middle East is one of the most polluted regions in the world, and Lebanon sits within this larger environmental challenge.
Why This Matters
A decade with no improvement in air quality means long-term exposure to harmful particles. PM2.5 is linked to respiratory diseases, cardiovascular complications, and reduced life expectancy. Lebanon’s stagnant pollution levels—paired with its region’s exceptionally high averages—underline the need for stronger environmental policies, emission control strategies, and long-term monitoring.
Conclusion
You inhale 22,000 breaths every day. If the data tells us anything, it is that the air behind those breaths is far from clean. Lebanon’s pollution levels remain elevated, unchanged, and embedded within a regional landscape that struggles with some of the highest PM2.5 levels globally. Understanding these patterns is a first step toward addressing them.

by mes22 | Nov 17, 2025 | Uncategorized
Youth unemployment remains one of the most urgent socioeconomic challenges across the Middle East. By tracking long-term trends in Lebanon, Jordan, the OECD benchmark, and the global average, a clearer picture emerges of how different countries have navigated the last three decades, and how education connects to opportunity.
Youth unemployment is rising sharply in Lebanon and Jordan.
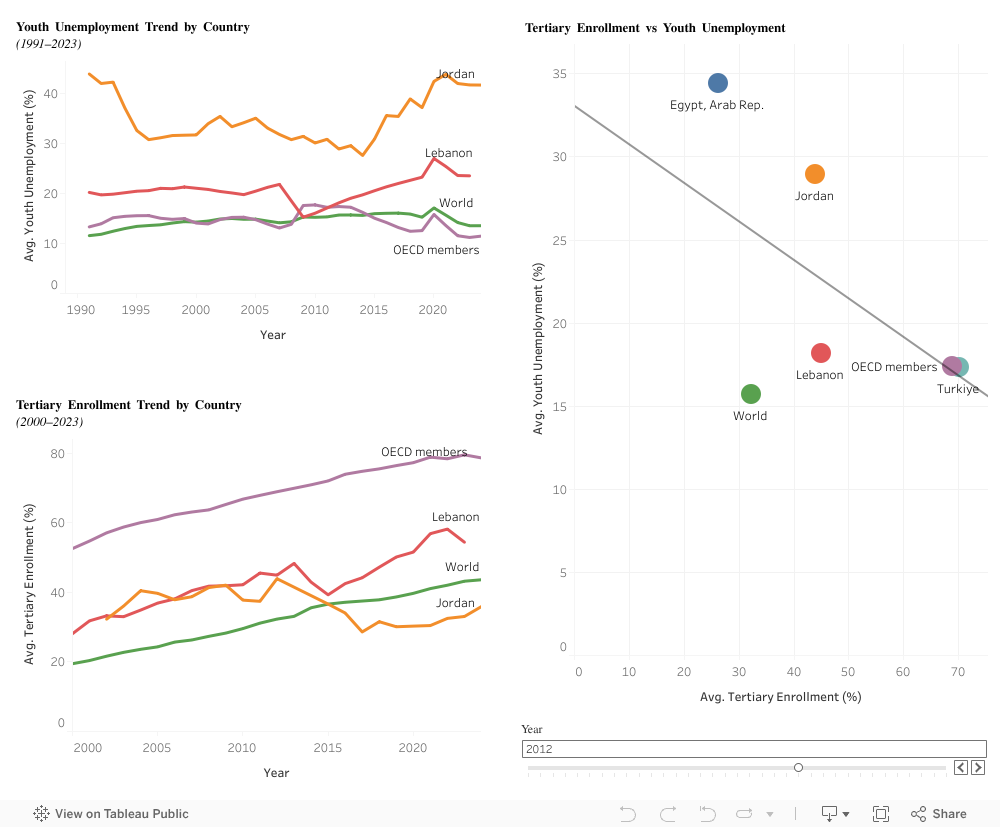
The long-run trend from 1991 to 2023 reveals a troubling pattern:
- Lebanon starts in the low 20s but steadily climbs upward, especially after 2010, reflecting the country’s deepening economic crisis, political instability, and financial collapse.
- Jordan begins around the mid-30% range and fluctuates over time, but recent years show unemployment rising again, approaching 40%.
In comparison:
- OECD members maintain far lower levels, typically around 10–15%, representing healthier labor markets.
- The world average stays in the mid-teens, serving as a neutral benchmark.
The gap between Jordan/Lebanon and OECD countries has widened over time, highlighting structural challenges in these Middle Eastern economies.
Lebanon stands out for a clear and concerning reason.
Lebanon’s youth unemployment has increased despite rising tertiary enrollment, making it distinct from global patterns.
Unlike OECD countries, where higher education is associated with smoother transitions into the labor market, Lebanese graduates face an economy unable to absorb them:
- Businesses are closing
- Emigration is rising
- The labor market lacks stability
- Economic growth is stagnant or negative
This creates a systemic mismatch between education levels and job availability.
Rising education doesn’t necessarily reduce unemployment.
The tertiary enrollment trends (2000–2023) show:
- OECD members achieve the highest and most consistent growth in tertiary enrollment, and maintain the lowest unemployment rate.
- Lebanon shows strong educational gains but no improvement in employment outcomes.
- Jordan sees a gradual increase but continues to face very high youth unemployment.
- The world average grows steadily, offering a smoother global reference point.
The patterns suggest that education alone does not reduce unemployment.
Instead, the labor market must have:
- Economic stability
- Job creation
- Demand for skilled workers
- A functioning political and financial environment
Without these, even highly educated young people struggle to find work.
The scatterplot reveals the core insight.
By allowing you to choose any year in the dashboard, the scatterplot compares:
- Tertiary enrollment (%)
- Youth unemployment (%)
in Jordan, Lebanon, OECD members, the World, and (in the scatterplot only) Egypt and Türkiye.
Across almost every year:
Countries with higher tertiary enrollment generally have lower youth unemployment.
But Lebanon and Jordan consistently sit above the trendline, meaning:
- Their youth unemployment is higher than expected
- Their labor markets are not converting education into opportunity
- Structural and economic constraints override the benefits of schooling
Meanwhile:
- OECD countries fall well below the trendline, showing that strong education systems paired with strong economies lead to better youth employment outcomes.
Conclusion
Higher education helps, but only when economies create opportunities for young people. Lebanon and Jordan demonstrate what happens when education expands but economies fail to keep pace. The OECD shows the opposite: stable economies transform education into employment.
The key question becomes: How can Middle Eastern economies create labor markets that reward education rather than punish it?

by aab75 | Nov 18, 2023 | Visualization
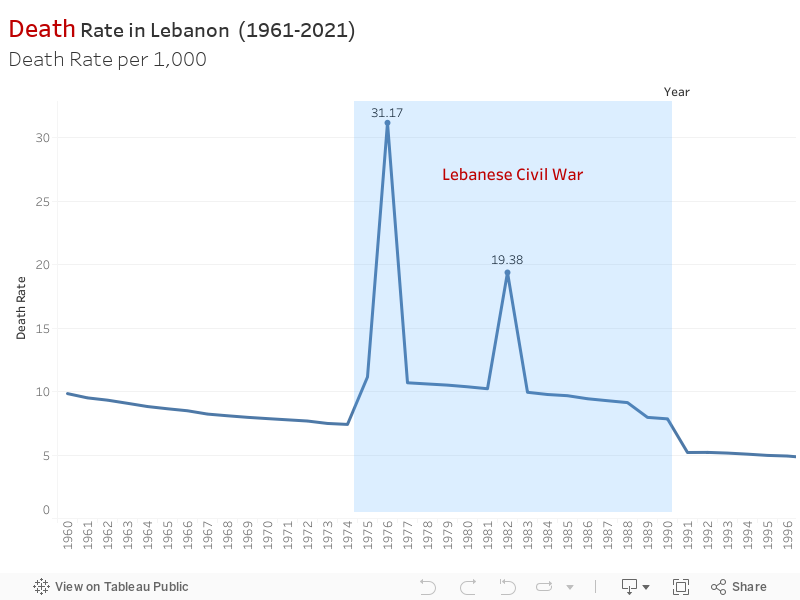
In light of recent events, we delved into a pressing issue: the unsettling fluctuations in mortality rates in Lebanon. It was evident that these shifts had deeper roots, impacting lives and reflecting significant historical events.
The data painted a stark picture. Between 1975 and 1990, Lebanon witnessed a devastating surge in mortality rates, reaching a staggering 31.17. The Lebanese Civil War cast a long shadow, leaving behind a legacy of loss and devastation that echoed in the mortality records.
Post-1990, there was a semblance of stability with mortality rates hovering around 4-5, despite intermittent spikes like the one in 2006 during the July War. It seemed like a fragile peace amid lingering echoes of conflict.
Then, at the dawn of 2019, another dramatic shift occurred. The onset of the COVID-19 pandemic jolted mortality rates sharply upward once more. It was a distressing reminder of how swiftly external factors could disrupt the delicate balance of life.
Contribution to SDG
SDG 3: Good Health and Well-being: The significant increase in mortality rates during the Lebanese Civil War, subsequent fluctuations due to regional conflicts like the July 2006 war, and the sharp increase attributed to the COVID-19 pandemic highlight the importance of SDG 3. It emphasizes the need for resilient healthcare systems, disease prevention, and access to quality healthcare, especially during periods of conflict and health crises.
SDG 16: Peace, Justice, and Strong Institutions: The impact of the Lebanese Civil War and regional conflicts on mortality rates underscores the relevance of SDG 16. Ensuring peace, stability, and strong institutions is vital to prevent the adverse effects of conflicts on public health and to establish systems capable of effectively managing crises and their aftermath.
SDG 10: Reduced Inequalities: The fluctuations in mortality rates due to historical conflicts and the COVID-19 pandemic might reveal disparities and inequalities in healthcare access, response, and resilience. Addressing SDG 10 involves reducing these disparities, ensuring equitable access to healthcare services, and mitigating the disproportionate impacts of crises on vulnerable populations.
by Youssef Daouk | May 4, 2020 | Visualization
This visualization shows the comparison of the dependency ratios of old age as well as children between several middle eastern countries.
It is seen that the child dependency ratio is not that high in Lebanon, but we chose to focus more on the old-age dependency. As seen in the visualization above, Old age dependency in Lebanon is 10.08, which is neither the best nor the worse in comparison to others in the region. But the good thing is that the elderly are still active in the economy, this can help boost the economic state in Lebanon if treated properly.
by Sari Hajjar | May 4, 2020 | Visualization
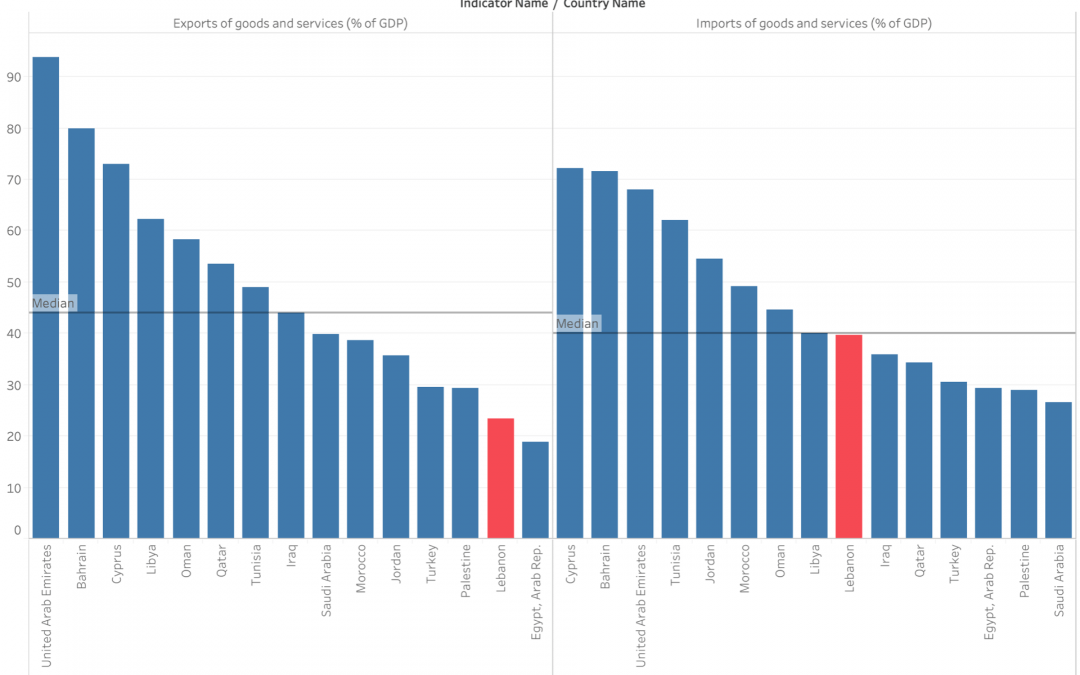
The poor economic situation in Lebanon is the result of multiple problems that led the this crisis. One of those problems is the imbalance of the exports and imports of goods and services in percentage of the country’s GDP.
It is clear that Lebanon has an export deficiency problem, with a percentage of imports double the percentage of exports, which is in turn way below the region median.