by Youssef Daouk | May 4, 2020 | Visualization
This visualization shows the comparison of the dependency ratios of old age as well as children between several middle eastern countries.
It is seen that the child dependency ratio is not that high in Lebanon, but we chose to focus more on the old-age dependency. As seen in the visualization above, Old age dependency in Lebanon is 10.08, which is neither the best nor the worse in comparison to others in the region. But the good thing is that the elderly are still active in the economy, this can help boost the economic state in Lebanon if treated properly.
by Zeinab Hassan | May 4, 2020 | Visualization
by Abbas Nassereddine | May 4, 2020 | Visualization
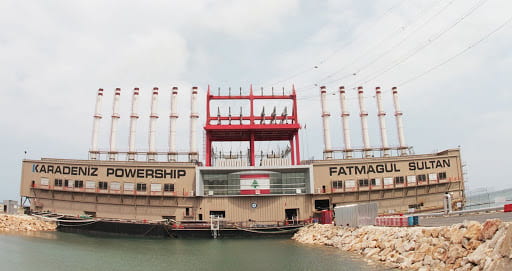
With growing power demand, Lebanese authorities decided to deploy powerships (Karpowership) in June 2012. These powerships remain a subject of debate among Lebanese officials to date. The visual portrays the effect of the introduction of the powerships on the distribution of contribution of different Non-EDL power sources to the Lebanese electricity network.
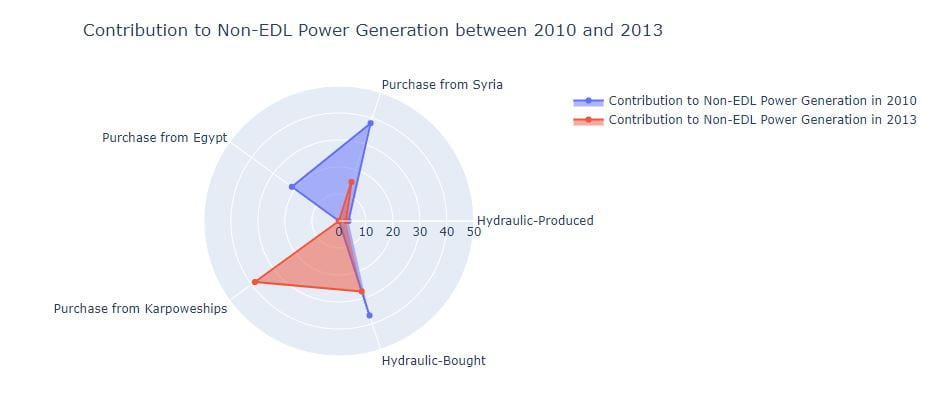
A significant drop in the contribution of foreign supply (Syria and Egypt) as well as the contribution of Hydraulic power generation was witnessed in 2013, in comparison to the significant emergence of powerships as main contributors (40% of Non-EDL power generation). Powerships continue to raise eyebrows regarding their cost efficiency and environmental friendliness in comparison to the other power sources.
by Sari Hajjar | May 4, 2020 | Visualization
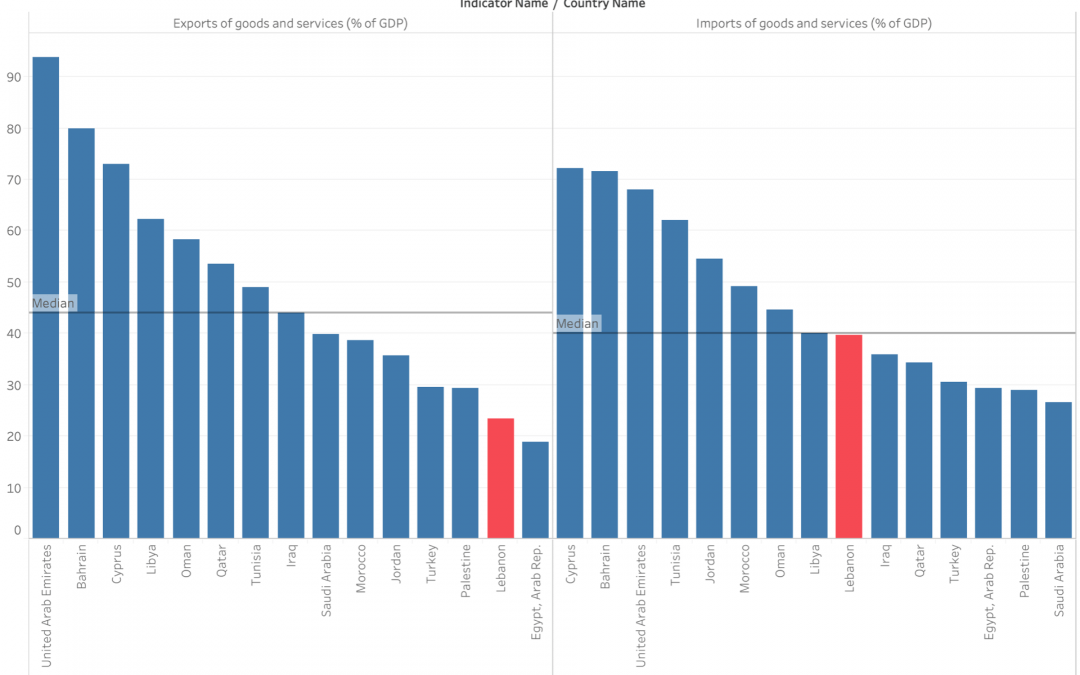
The poor economic situation in Lebanon is the result of multiple problems that led the this crisis. One of those problems is the imbalance of the exports and imports of goods and services in percentage of the country’s GDP.
It is clear that Lebanon has an export deficiency problem, with a percentage of imports double the percentage of exports, which is in turn way below the region median.
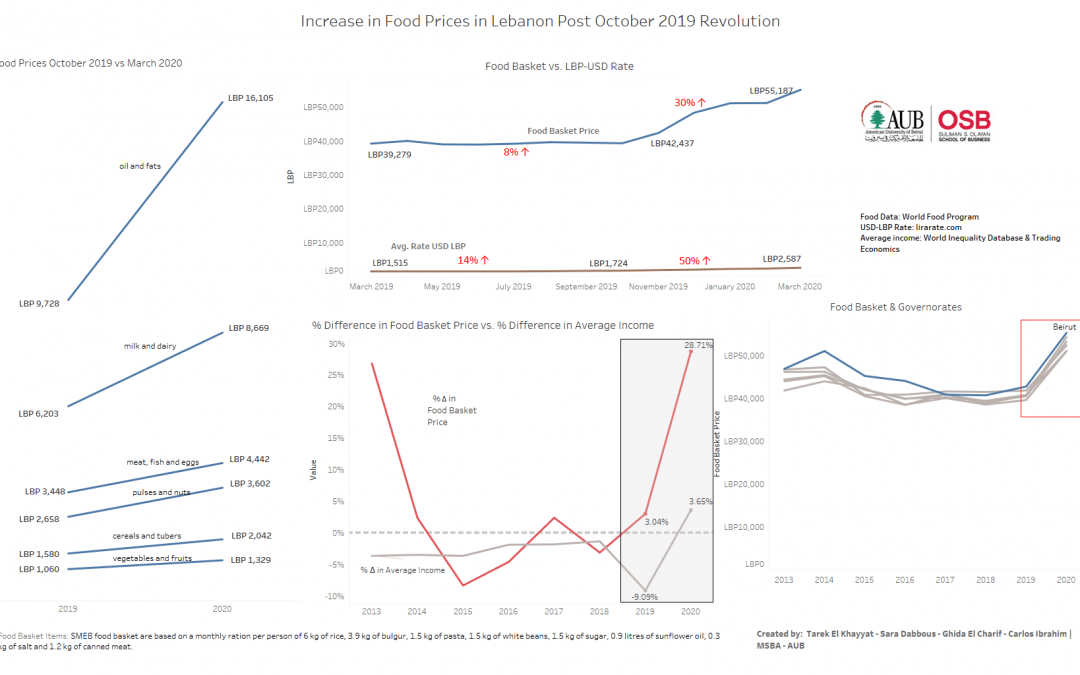
by Sara Dabbous | May 4, 2020 | Visualization
Best viewed on a computer screen!