
With growing power demand, Lebanese authorities decided to deploy powerships (Karpowership) in June 2012. These powerships remain a subject of debate among Lebanese officials to date. The visual portrays the effect of the introduction of the powerships on the distribution of contribution of different Non-EDL power sources to the Lebanese electricity network.
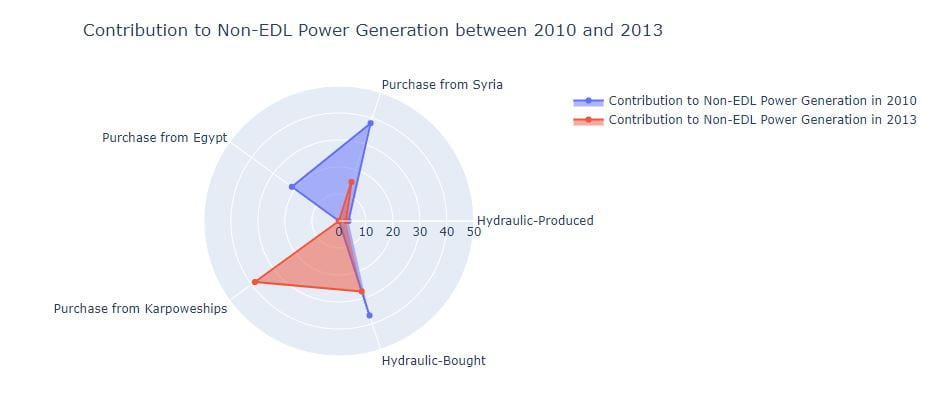
A significant drop in the contribution of foreign supply (Syria and Egypt) as well as the contribution of Hydraulic power generation was witnessed in 2013, in comparison to the significant emergence of powerships as main contributors (40% of Non-EDL power generation). Powerships continue to raise eyebrows regarding their cost efficiency and environmental friendliness in comparison to the other power sources.
0 Comments