Lebanon Road Crashes: Beyond Metrics; Capturing the Human Impact
Crash injuries are ranked as the eighth leading cause of global mortality across all age groups and this is predicted to climb to seventh by 2030. Lebanon, in particular, stands out with a safety record deemed “among the worst globally” by the World Bank. According to 2020 data from the World Health Organization (WHO), Lebanon holds the 89th position in global safety rankings.
Due to the importance of the above-stated issue, we analyze the primary causes of road crashes, focusing on fatalities and the most affected population, wrapping up with recommendations for authorities.
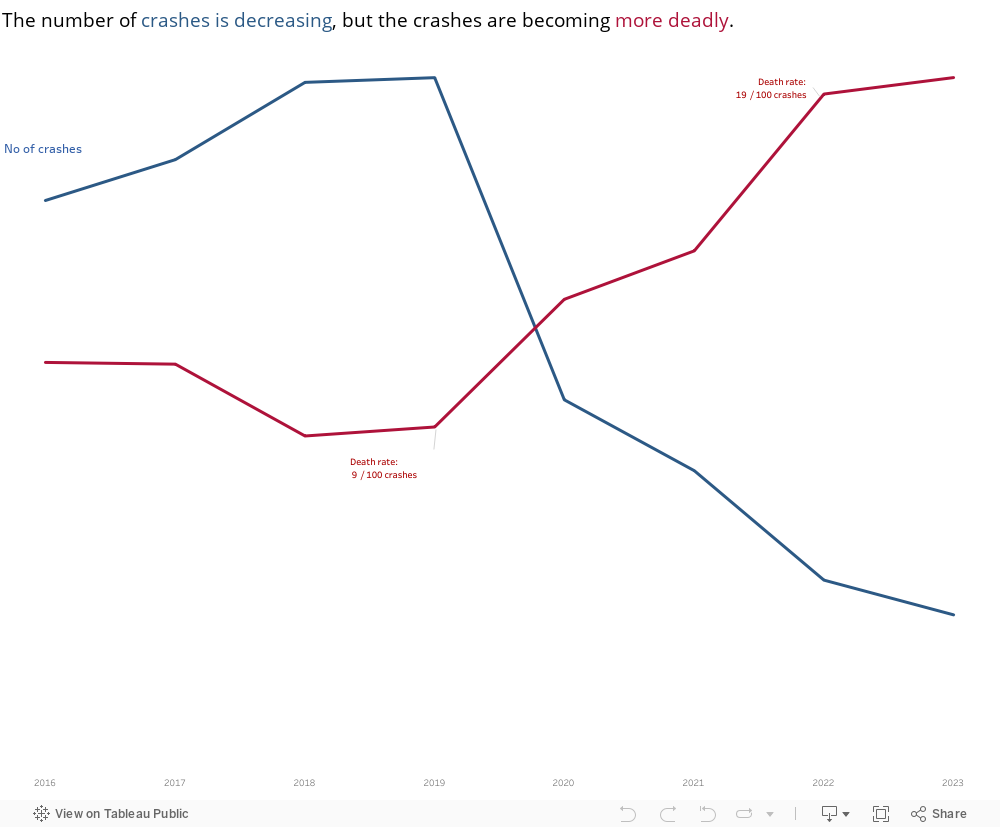
To start with, the number of crashes in Lebanon followed an upward trend until it reached its peak in 2019. After the economic crisis in Lebanon and the increase in gasoline prices in the country, the number of crashes decreased and started following a downward trend till today. Although these numbers seem promising, when examining the death rate / 100 crashes, we notice that it has been following an upward trend since 2019. This suggests that while the overall number of accidents in Lebanon has decreased compared to four years ago, the severity of these accidents has escalated.
Now we are interested in checking the causes behind crashes with fatalities to understand what is happening. The figure below shows that there are two main causes of these crashes:
1- Driver not abiding by the speed limit
2- Pedestrian not abiding by crossing the street rules
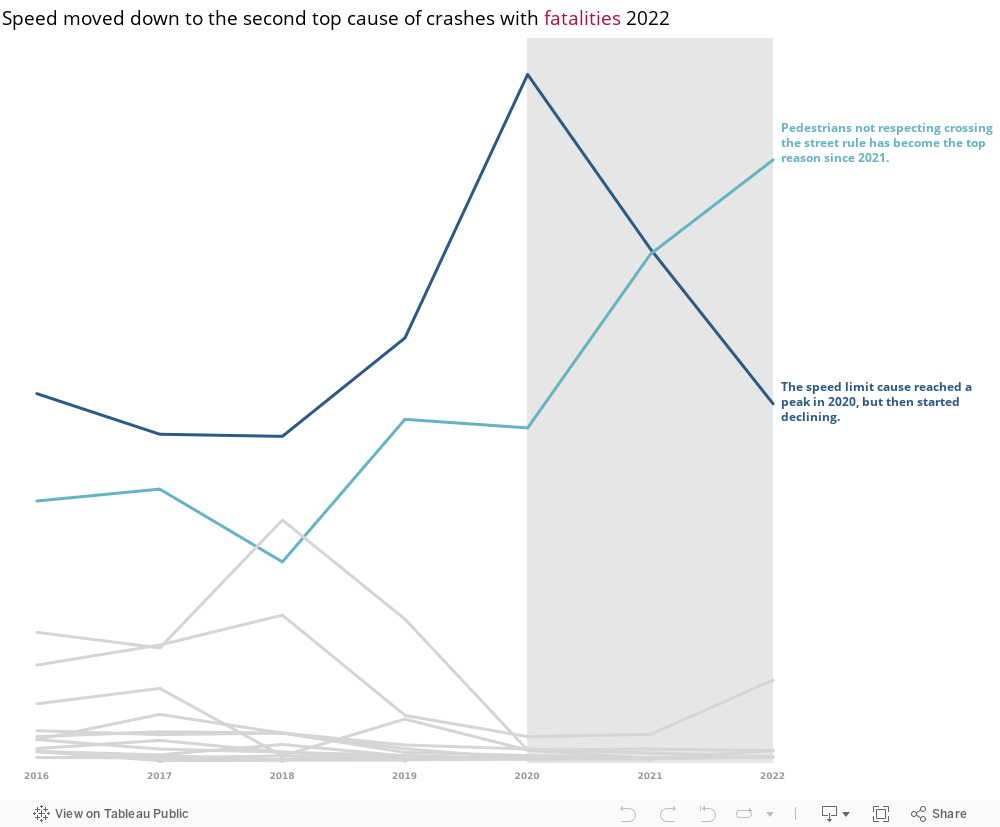
As the above figure shows, pedestrians not abiding by crossing the street rules has become the top cause leading to crashes with fatalities.
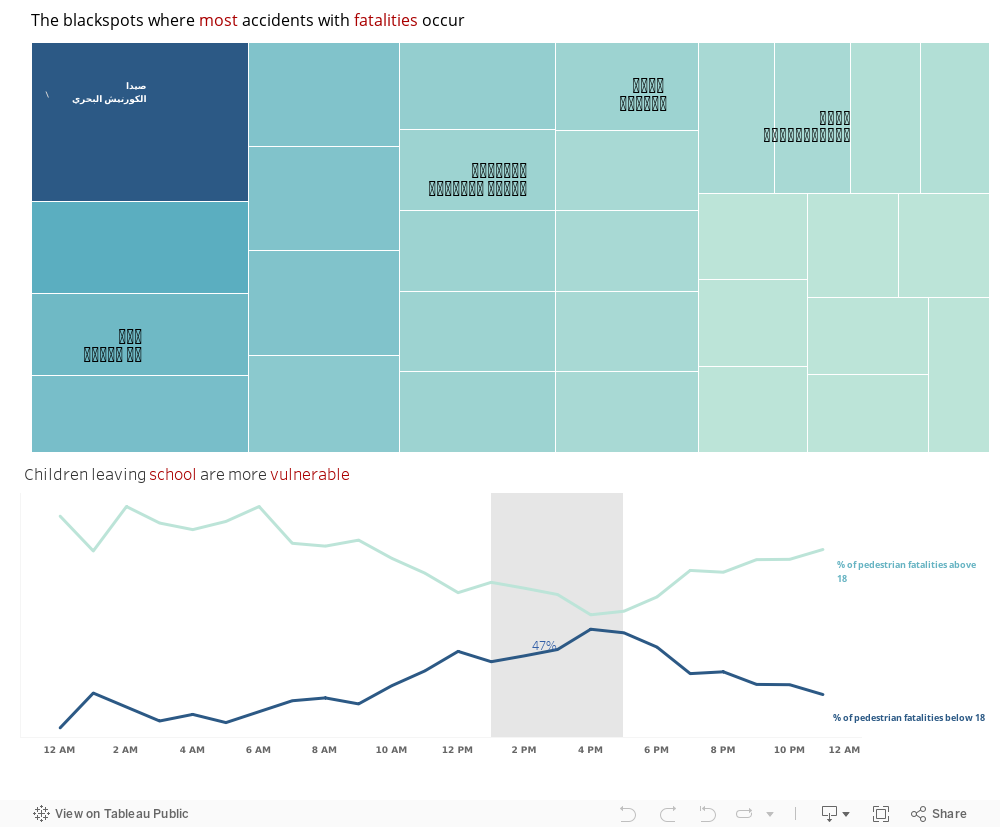
Now let’s keep this in mind and check for “blackspots” or spots with high crashes leading to fatalities to understand what is happening.
The figures below show that:
1- There are several blackspots in Lebanon, 5 of which are common findings with ISF Lebanon. After checking all 5 locations, we found out that all have a structure similar to highways.
2- The percentage of pedestrian fatalities among children reaches its peak between 2 PM and 4 PM – end of school hours time.
Now, we need to check what is the most vulnerable population (that has the highest fatality rate) and what is the main cause of such crashes. We do so by focusing on two of the blackspot locations: Saida (الكورنيش البحري) and Carantina (فوروم دو بيروت).
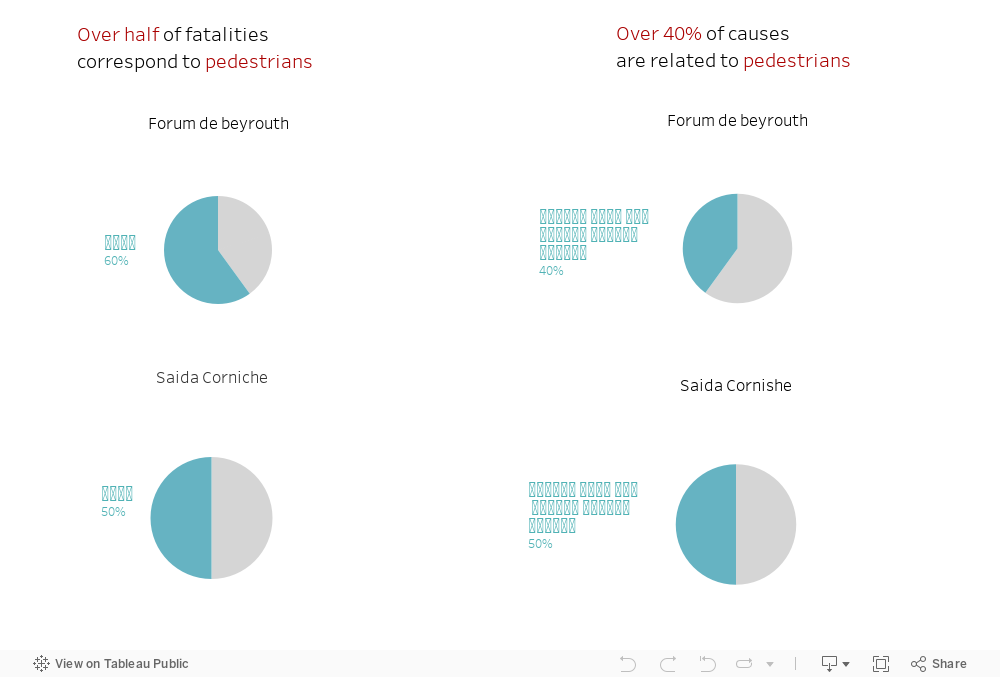
When drilling down into the two blackspots, we realize the following:
1- Pedestrians constitute at least 50% of the fatalities.
2- At least 40% of ‘Cause of Crash’ is: Pedestrian not abiding by street crossing rules, a cause discussed earlier above.
But here a question arises: Does this sound as if we are over-blaming pedestrians? What rules are we talking about? Does the street situation in Lebanon, facilitate crossing the streets for pedestrians? As we all know, in most cases, the answer is no, we don’t. Then, what could be done?
Since we all know the economic situation in Lebanon, we are here to offer low-budget approaches that are applied in other countries and have proved their efficiency:
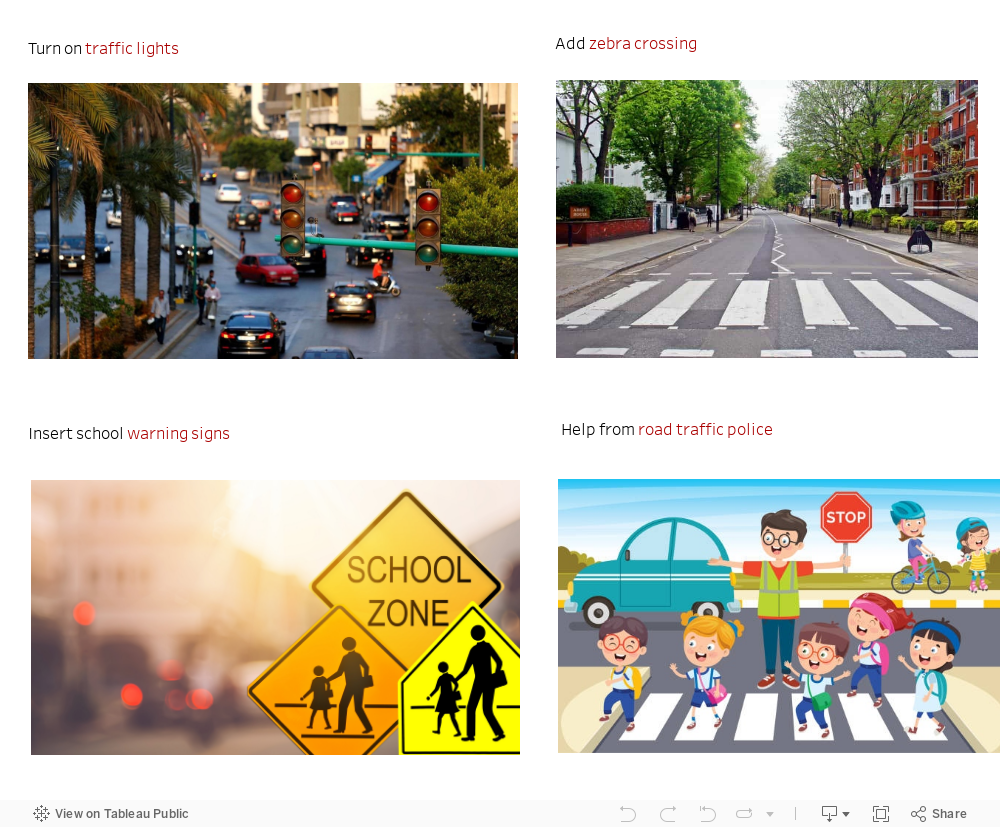
1- Turn on traffic lights, at least those that are on junctions and cross points. This could be done in collaboration with civil society and NGOs that would be pleased to help by providing electricity supply through their private generators or solar stations; some initiatives have already been done.
2- Paint specific locations where pedestrians need to cross roads by Zebra Crossing in order to signal for cars to slow down and pay more attention to pedestrians.
3- When it comes to needed areas around schools, add school warning signs. Traffic police could also help during out-of-school hours on certain roads.
The figures below provide examples of what has been discussed earlier.
In addition to the above-stated on-ground actions, spreading awareness is a key action that could be performed at different levels targeting different age groups, starting from intensifying road safety topic in school programs at early age stages, reaching to broadcasting awareness campaigns that target older age groups.
Acknowledgement:
All data used for this blogpost is retreived directly from ISF who has thankfully collaborated and provided the data needed covering years 2016 – 2023.