by ynh05 | Nov 22, 2025 | Uncategorized
Lebanon’s hospitality industry has endured some of the toughest years in its history. COVID emptied hotels and restaurants almost overnight. The economic collapse made it difficult for businesses to operate amid power cuts, fuel shortages, and soaring costs. More recently, regional tensions have slowed travel and pushed many southern and rural destinations into survival mode.
Yet the latest tourism data shows something important. The treemap reveals that most hotels remain concentrated in districts like Matn, Keserwan, and Byblos. At the same time, the tourism index shows that some of the most appealing destinations for visitors are elsewhere. Tripoli, Western Beqaa, Hasbaya, and Nabatieh all rank high in tourism experience despite having far fewer hotels.
This gap between where tourists want to go and where hospitality infrastructure actually exists is one of Lebanon’s biggest lost opportunities. It reflects years of underinvestment made worse by crisis after crisis.
But it also points to a clear path forward. Investing in roads, stable electricity, clean water, internet connectivity, and the preservation of cultural and natural sites would immediately boost the capacity of high-potential regions. Strengthening infrastructure beyond Beirut and Mount Lebanon would unlock new jobs, revive local economies, and distribute tourism revenue more evenly across the country.
Lebanon does not need to rebuild its appeal. It needs to rebuild the foundation that allows hospitality to grow. With the right infrastructure, the regions that tourists already love can finally receive the investment they deserve.

by jjh30 | Nov 21, 2025 | Uncategorized
Tourism has always been one of Lebanon’s brightest sectors, bringing life, movement, and opportunity to towns across the country. But when we look closely at where this activity is actually happening, an important pattern becomes clear: tourism is not spread evenly. It is concentrated intensely in just a handful of towns. And with that concentration comes one of Lebanon’s biggest hidden challenges: environmental pressure.
Restaurants, cafés, and hotels create jobs, attract visitors, and fuel local economies, but they also generate large amounts of waste, rely heavily on single-use plastics, and demand significant water and electricity. When these establishments cluster together in small areas, the strain on municipal systems becomes visible faster than the benefits.
To understand this pressure, we visualized the distribution of tourism establishments across the top 10 tourism towns in Lebanon. The result was striking. Two towns, Aabbesiyi and Baalbek stood far above the rest.
Aabbesiyi hosts 30 restaurants, 25 cafés, and 4 hotels. Baalbek hosts 39 restaurants, 10 cafés, and 2 hotels. Together, they make up 55% of all tourism establishments among the top towns.
This isn’t a small detail. This is the story.
These two towns carry more tourism activity, more food and packaging waste, more daily electricity and water consumption, and more visitor movement than anywhere else. And because the environmental impact is highest where the activity is highest, this concentration creates an opportunity that Lebanon has never fully used: beginning sustainability efforts where they matter most.
Instead of trying to build a national sustainability plan all at once, we can start with a focused, practical approach. Aabbesiyi and Baalbek are ideal places to pilot a Sustainable Tourism Starter Program, a coordinated effort that brings together cafés, restaurants, hotels, municipalities, and visitors under a simple goal: reducing the environmental footprint of the tourism experience.
Why start here?
Because here, the impact is immediate.
Because here, businesses are clustered close enough to benefit from shared guidelines and joint awareness efforts.
Because here, improvements don’t just make environmental sense, they make social and economic sense too.
Global sustainable tourism frameworks follow the same principle: begin where tourism activity is heaviest. It creates quicker results, easier monitoring, and a clearer path for scaling what works. And both Aabbesiyi and Baalbek already have something many towns lack: active business communities, strong visibility, and a steady visitor flow that makes sustainability initiatives more likely to succeed.
From shared sustainability guidelines to town-level branding like “Green Aabbesiyi” and “Eco-Baalbek,” these hubs can become the first Lebanese destinations to embrace environmental responsibility as part of their identity. With support from NGOs, municipal authorities, schools, and local partners, the program can grow beyond awareness campaigns into a committed, long-term approach to managing waste, water, energy, and visitor behavior. And once we see the impact, once the model proves itself, the same practices can be adopted by other towns, one step at a time.
Our visualization points to one undeniable truth: not all tourism towns carry the same environmental weight. Turning this insight into action gives Lebanon a real chance to move toward a greener tourism future, starting exactly where impact will be felt most.

by egh13 | Nov 19, 2025 | Uncategorized
Introduction
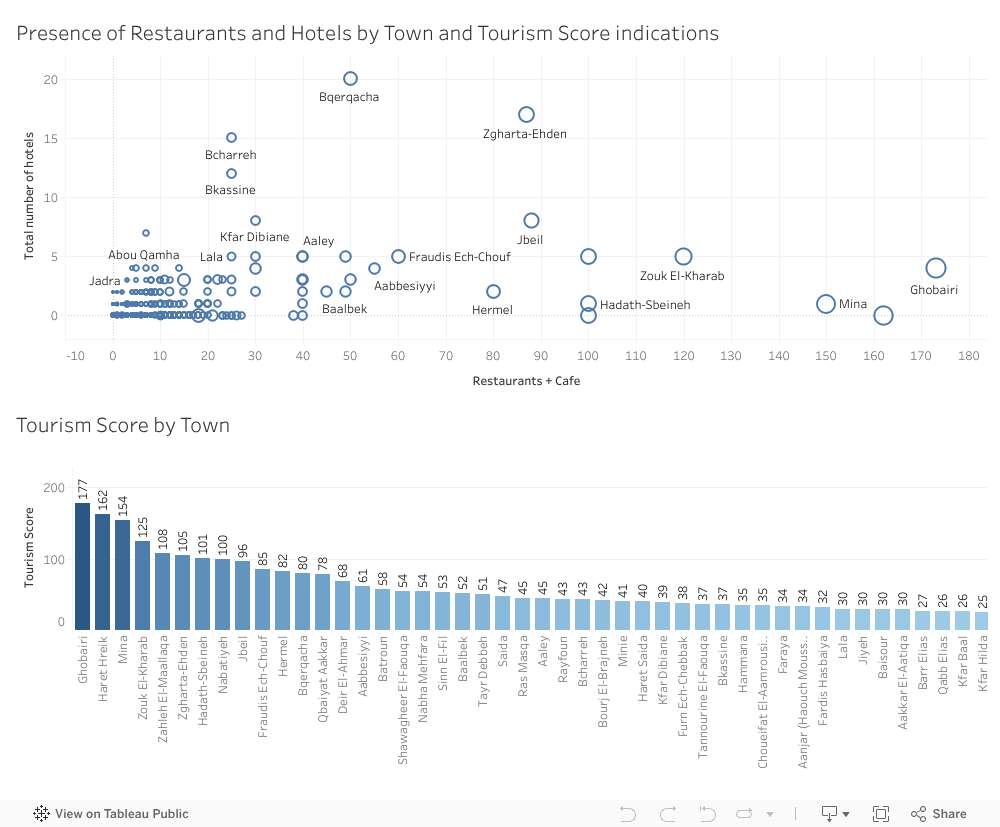
Tourism in Lebanon is often celebrated for its beautiful landscapes, cultural heritage, and vibrant towns. But behind these well known attractions lie a more practical question: which towns are actually equipped to support tourism on a daily basis? To explore this, I created a dashboard comparing Lebanese towns based on the number of restaurants and cafes, the number of hotels, and an overall Tourism Score that ranks towns according to their tourism readiness. Instead of relying on impressions or reputation, the data reveals how tourism infrastructure is truly distributed across the country. The results highlight unexpected leaders, surprising gaps, and a clearer understanding of which towns are prepared to welcome visitors and which ones still lack the necessary services.
Key Insights from the Dashboard
-
Only a few towns offer a complete tourism ecosystem
The scatterplot shows that just a small number of towns have both high numbers of restaurants and cafes and multiple hotels. Towns such as Zgharta–Ehden, Bcharreh, and Bqerqacha stand out because they have a balanced mix of services that can support both short-term and overnight visitors.
-
Ghobairi and Mina show strong activity but limited overnight capacity
On the far right of the scatterplot, Ghobairi and Mina appear with very high numbers of restaurants and cafes but almost no hotels. This suggests strong commercial and visitor activity but mainly in the form of day visits rather than extended stays. Their dense hospitality presence raises their tourism scores even though accommodations are limited.
-
The Tourism Score reveals unexpected top-ranking towns
The Tourism Score bar chart shows that the towns with the highest tourism potential are not always the ones typically associated with tourism. Ghobairi ranks first with a score of 177, followed by Haret Hreik and Mina. Meanwhile, popular tourist towns such as Zahle, Jbeil, and Zgharta–Ehden perform well but do not lead the ranking. This shows that infrastructure, more than reputation, determines tourism readiness.
-
Most towns have very limited tourism infrastructure
A large cluster of points near the origin of the scatterplot shows that most Lebanese towns have fewer than 10 restaurants and almost no hotels. These towns may rely on nearby hubs or seasonal tourism, but they lack the facilities needed to attract or accommodate visitors consistently.
-
Urban density influences tourism scores more than geography
The data suggests that high-scoring towns tend to be commercially dense and urbanized rather than simply scenic or historic. This highlights the importance of services such as dining and accommodation options as the real foundation of tourism potential.
Conclusion
The dashboard reveals that tourism activity in Lebanon is unevenly distributed. A small number of towns dominate because they offer the right mix of infrastructure, while many others, despite natural or cultural advantages, lack the essential services needed to support consistent tourism. These findings point to two opportunities. First, towns rich in natural or cultural attractions but lacking infrastructure could benefit from targeted development. Second, high-scoring, service-dense towns can act as anchors for broader regional tourism strategies. Understanding these patterns through data helps support more balanced tourism development across the country and encourages investment where it can make the most meaningful impact.

by jkg05 | Nov 17, 2025 | Dashboard, Visualization
In the high-stakes world of real estate and tourism investment, there is a prevailing feeling that the map has already been drawn. We are constantly told that the “smart money” has already moved, that the best locations are taken, and that finding a new opportunity means fighting for scraps in saturated markets. When we look at the industry, we usually see two things: expensive, crowded success stories, or underdeveloped ghost towns that no one wants to visit.
But sometimes, if you look at the data differently, the map changes.
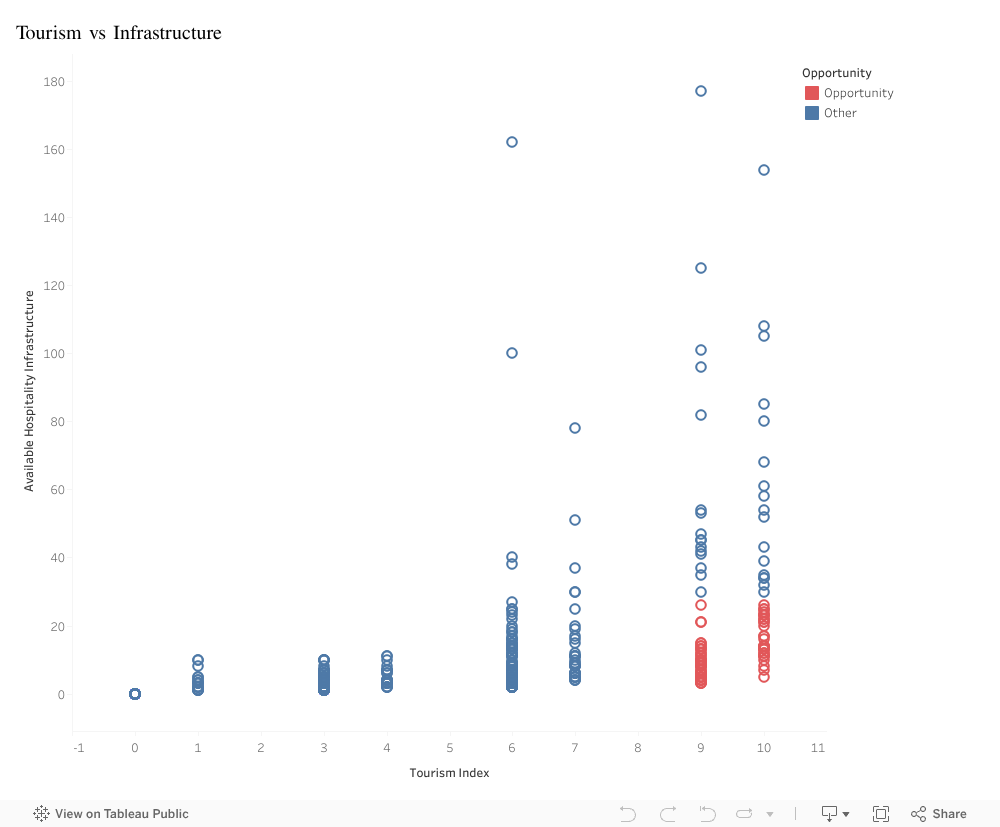
In this visualization, I analyzed the relationship between two critical factors: the Tourism Index (the raw, magnetic appeal of a destination, from natural wonders to historical sites) and Available Hospitality Infrastructure (the actual supply of hotels, restaurants, and services).
At first glance, the sea of blue dots confirms the traditional idea. The data follows a predictable, efficient path. In the top right, you see the famous destinations: high appeal matched by high infrastructure. These are successful, but they are also a dangerous gamble; expensive to enter and fiercely competitive. In the bottom left, you see the opposite: low appeal and low infrastructure. No surprise there.
But as you scan the bottom right of the chart, the pattern fractures.
This is where the red dots appear, and they tell a completely different story. These data points represent towns with a Tourism Index of 9 or 10, world-class destinations that tourists are desperate to visit. Yet, their infrastructure bars are effectively at zero.
This gap represents a massive market failure, and for an investor, a market failure is a goldmine.
These aren’t towns that need marketing; they are towns that need capacity. The demand is already there, waiting for someone to unlock it. By ignoring the crowded top-right corner and focusing on this specific cluster, investors can bypass competition entirely. Building here means you aren’t just another hotel in a crowded city; you are the hotel in a destination people are already fighting to see.
Big Idea
The data reveals a rare and profitable anomaly: a specific cluster of towns with world-class tourist demand but near-zero infrastructure. Investors should pivot away from saturated markets and target these “red dot” locations to secure a first-mover advantage in destinations where demand drastically outstrips supply.