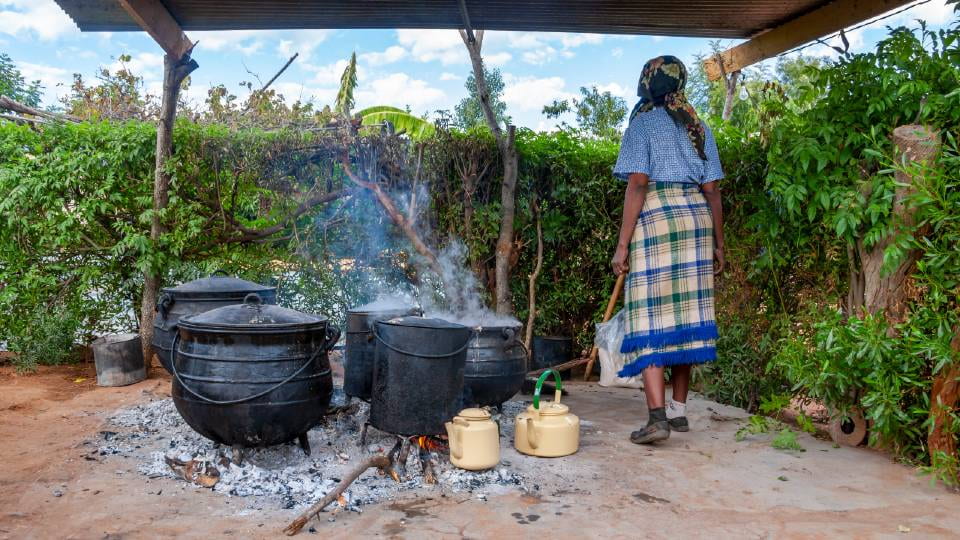
Nigeria, a vibrant and populous nation in West Africa, grapples with the critical issue of access to clean fuels and technologies for cooking. As an integral component of daily life, cooking methods profoundly impact the health, environment, and overall well-being of the Nigerian population. The dynamics of clean cooking solutions in Nigeria are closely intertwined with the threads of economic growth, underscoring the necessity for innovative approaches that not only tackle environmental challenges but also foster the nation’s economic robustness and promote inclusive development.
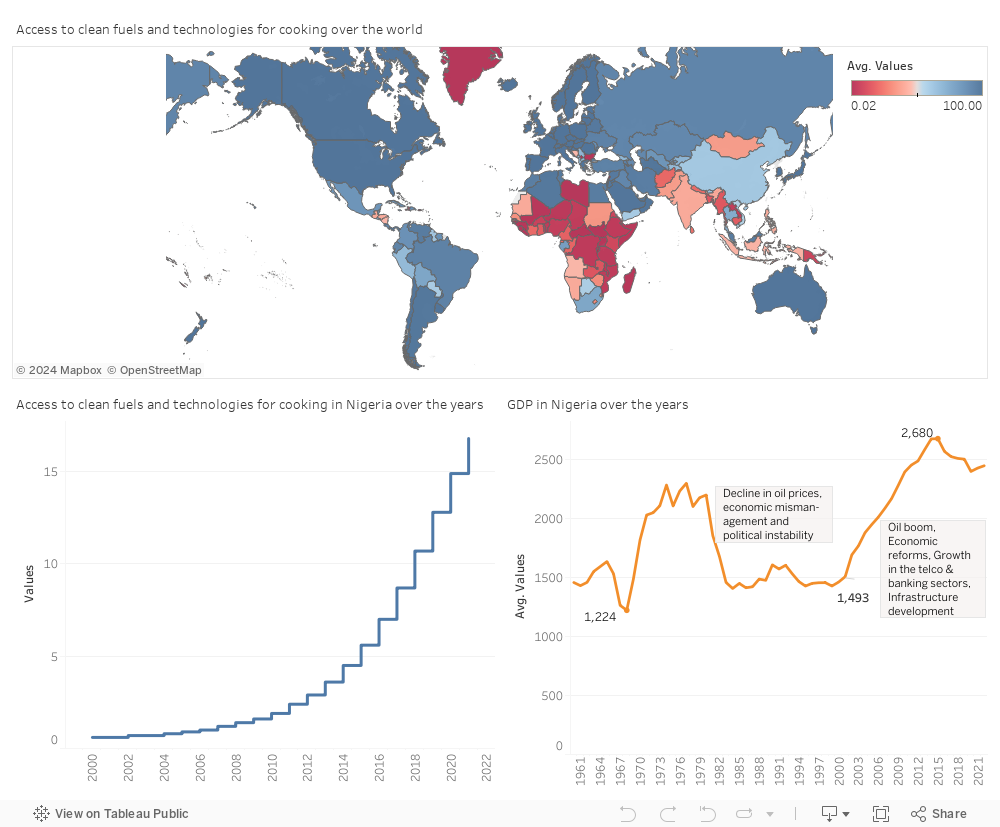
Based on the previously displayed map, it’s evident that the majority of African countries face limited or no access to clean fuels and technologies for cooking. To investigate this trend further, Nigeria has been selected as a focal point to assess whether there have been improvements in this indicator over the years.
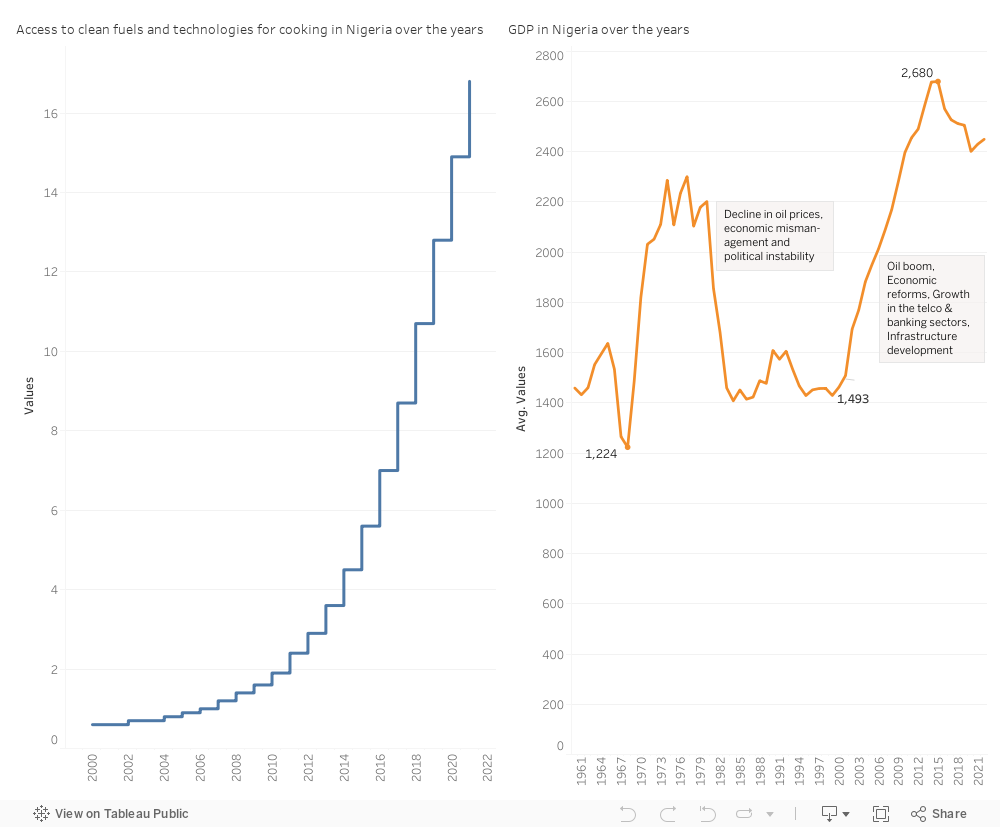
It is noteworthy that access to clean fuels and technologies for cooking in Nigeria has shown a positive trajectory, with discernible advancements noted since 2001. This gradual increase can be attributed to a combination of government initiatives, infrastructure development, international support, economic growth, awareness campaigns, technological advancements, and community engagement. Policies and subsidies, investments in energy infrastructure, collaborations with international organizations, and economic development have collectively contributed to making clean cooking fuels more affordable and accessible. Moreover, efforts to raise awareness about the health and environmental benefits of clean cooking, along with advancements in technology, have played crucial roles in promoting the adoption of clean cooking practices across the country.
The rise in Nigeria’s GDP alongside increased access to clean fuels and technologies for cooking is a symbiotic relationship with multiple interconnections. Economic growth, as reflected in the increasing GDP, contributes to improved affordability of clean cooking technologies, fostering a positive impact on household incomes. This economic development empowers the government to allocate resources to initiatives and subsidies that enhance accessibility to cleaner fuels. Moreover, higher GDP facilitates investments in energy infrastructure and research, fostering technological advancements that make clean cooking options more efficient. The overall improvement in public health, heightened environmental awareness, and strengthened international collaborations are additional outcomes of this dual progress. However, recognizing and addressing potential disparities in the inclusive distribution of these benefits remains crucial for a comprehensive understanding of the dynamic relationship between Nigeria’s economic growth and the adoption of clean cooking practices.
The efforts to increase access to clean fuels and technologies for cooking, along with economic growth, align with several United Nations Sustainable Development Goals (SDGs):
SDG 1 – No Poverty: Economic growth, when inclusive, can contribute to poverty reduction, and improved access to clean cooking technologies supports this goal by enhancing the living standards of vulnerable populations.
SDG 3 – Good Health and Well-being: Access to clean fuels and technologies for cooking directly impacts health outcomes by reducing indoor air pollution and related health issues.
SDG 7 – Affordable and Clean Energy: The goal of ensuring access to affordable, reliable, sustainable, and modern energy for all directly relates to efforts to improve access to clean cooking technologies.
SDG 10 – Reduced Inequality: Efforts to ensure inclusive economic growth and equitable access to clean cooking technologies contribute to reducing inequalities within society.
SDG 11 – Sustainable Cities and Communities: Urban planning and infrastructure development related to clean cooking technologies contribute to building sustainable cities and communities.
SDG 13 – Climate Action: The adoption of clean cooking technologies aligns with climate action goals by reducing reliance on traditional biomass fuels, contributing to mitigating climate change.
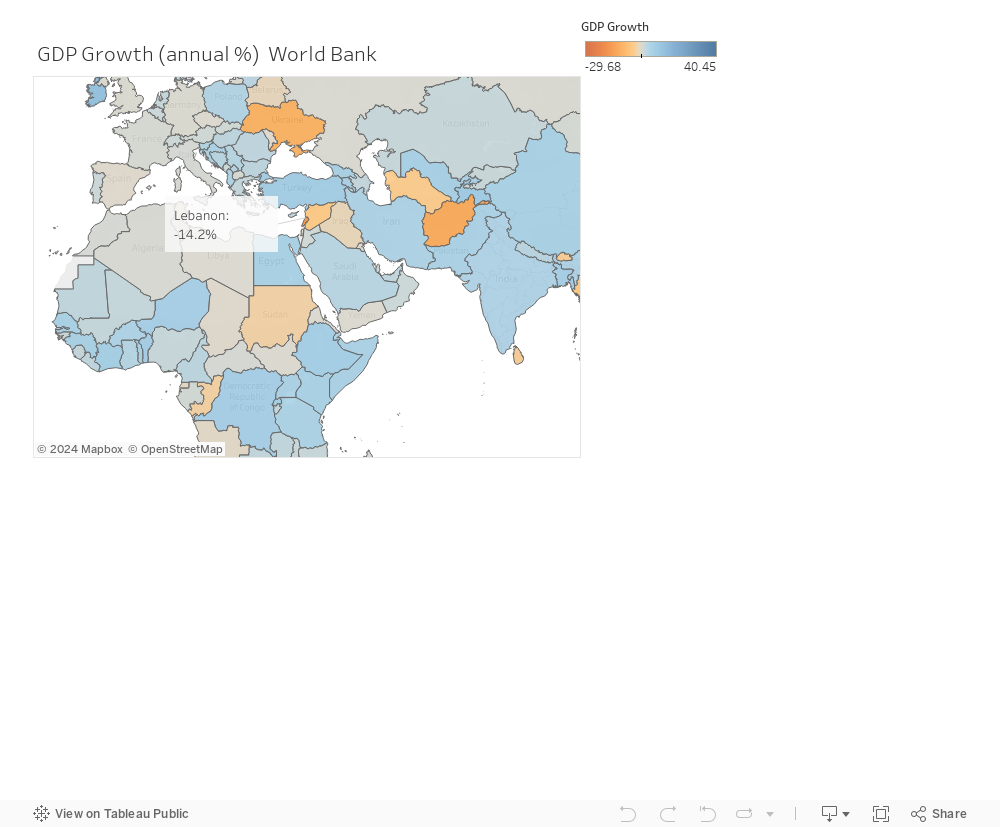
Lebanon has been ranked as one of the top countries with severe negative GDP growth. As shown in the below graph, Lebanon’s GDP growth is also lower than that of its neighboring countries, including Syria which has been facing a war since 2011.
In order to check for potential causes of this severe negative GDP growth, Lebanon was compared with other countries on the level of economic indicators. What is found interesting is that Lebanon has the highest external debt (expressed as % of GNI) compared to other countries, as the below figure shows.
Let’s dig deeper into the relationship between external debt and GDP growth in Lebanon. As the below figure shows, when Lebanon’s external debt made a big jump and increased by 130% (from 147% to 277.9%), GDP growth had a severe decline of 15.5% (from -4.2% to 19.7%).
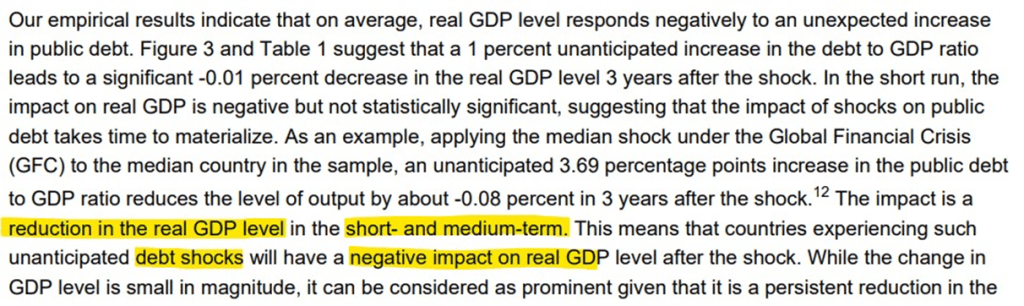
This relation is validated by a study performed by The Monetary Fund that states that external debt shocks have a negative impact on GDP in both, the short- and medium-terms. This is further shown in bellow screenshot taken from the study (The Monetary Fund,2022).
For this reason, The Monetary Fund, in collaboration with the World Bank, has developed The Heavily Indebted Poor Countries (HIPC) Initiative that provides debt relief for qualifying countries if these countries develop a Poverty Reduction Strategy Paper (PRSP) to show how this relief would help them re-increase there GDP.
Public health is linked to the economic strength of a country as health expenditure is positively associated with the productivity and GDP of a nation. The advances and improvement of many of the main forces driving economic growth over time span such as technological progress, education, and physical capital accumulation contribute to the improvement of health services in countries. However, with the world divided between first, second and third world countries, public health situation differs between economically strong and weak countries.
COVID-19, as a recent event, shed light on the differences in health systems within the Arab world, especially that the region includes some of the richest oil producing countries as well as poor and war-torn countries.
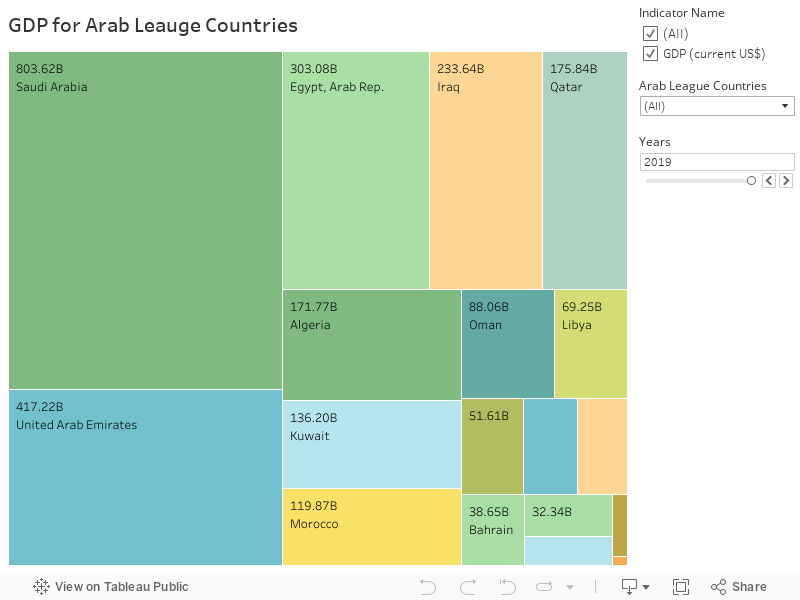
The below graph visually views the differences between the GDP of the Arab League Countries in the Year 2019. For example, at the top of the GDP scale , we have Qatar, a relatively geographically small GCC country and biggest producer of natural gas, has a GDP of $175 billion which is more than GDP of Libya, Lebanon, Sudan and Yemen combined.
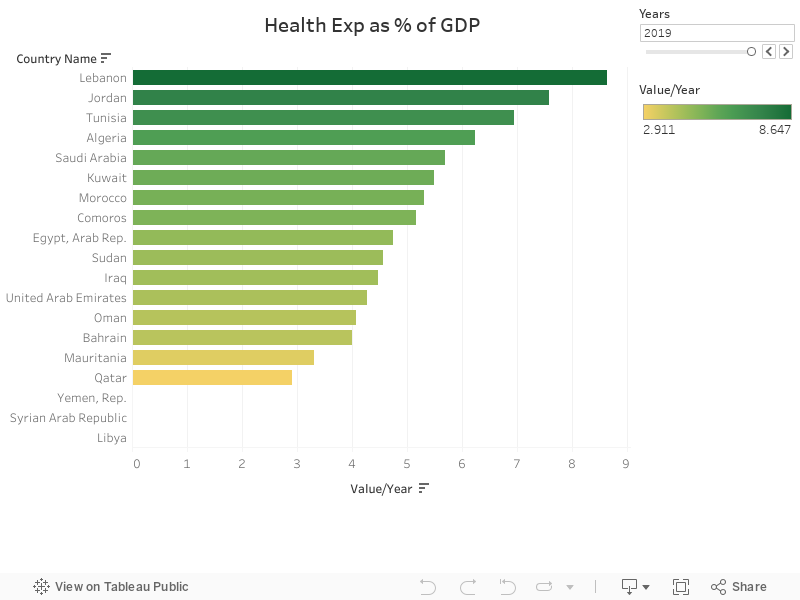
The size of a country’s GDP determines the monetary value of its health expenditure as a percentage of GDP. Comparing the GDP tree map with Health Expenditure graph below , we can see that countries with high GDP (e.g, Qatar, UAE) shows small percentage of health expenditure while Countries with low GDP (e.g, Lebanon, Jordan) shows larger percentage of health expenditure.
In monetary terms, Lebanon has a highest total health expenditure % in the Arab World which amounts to 8.64%($51.6 B)= $4.45 billion. On the other hand, Qatar has a low health expenditure % of 2.9 but when multiplied by the country’s GDP, it amounts to 2.9%($175 B)= $5 billion.
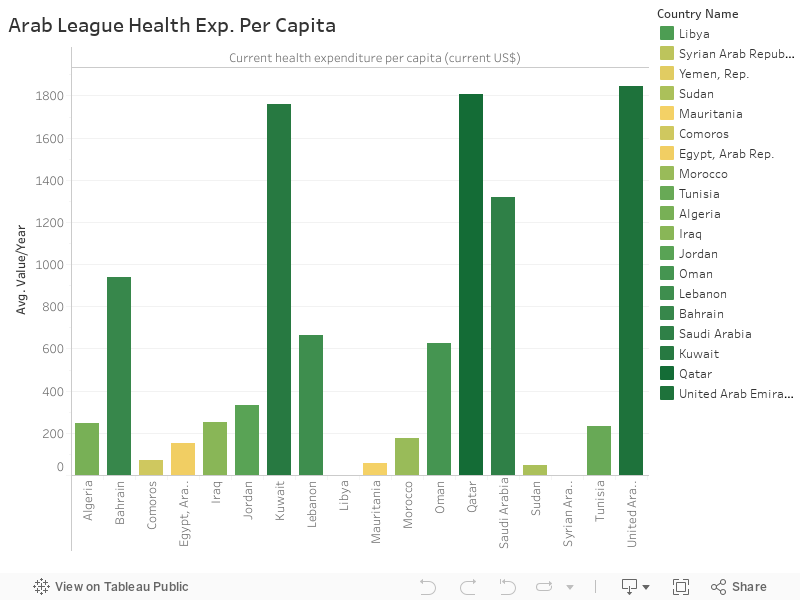
Health Expenditure per capita shows the direct impact of GDP of a country on its health spending. As shown in the below graph, countries with high GDP have high health expenditure compared countries with low GDPs.
The above discussion pointed out the relationship between the strength of a country’s economy and its health spending. The question that remains is “How does this reflect on the health of people?”
Diseases
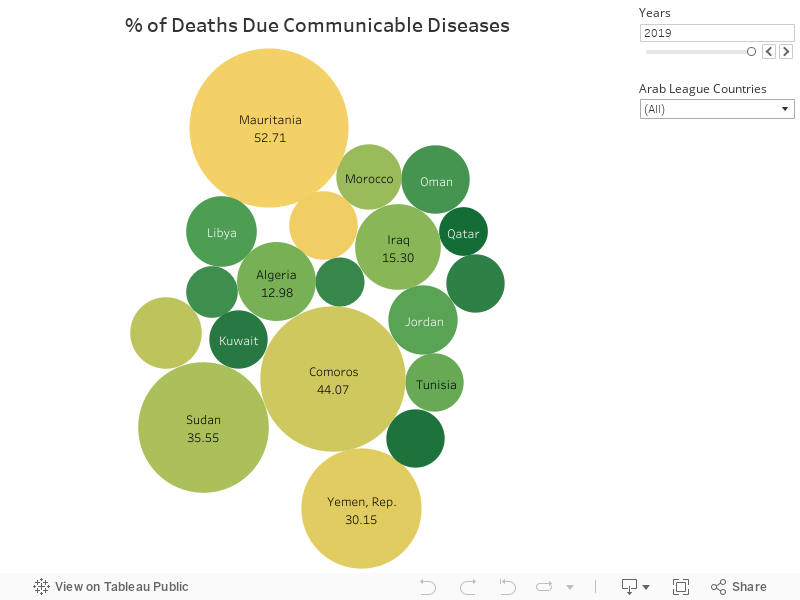
Countries that allocate large budgets for the development of the health sector and public health perform well in the face of diseases, especially communicable diseases and pandemics such as COVID-19. The below bubble chart shows that countries with low GDP have the highest percentage of deaths by communicable diseases.
Life Expectancy and Death Rate
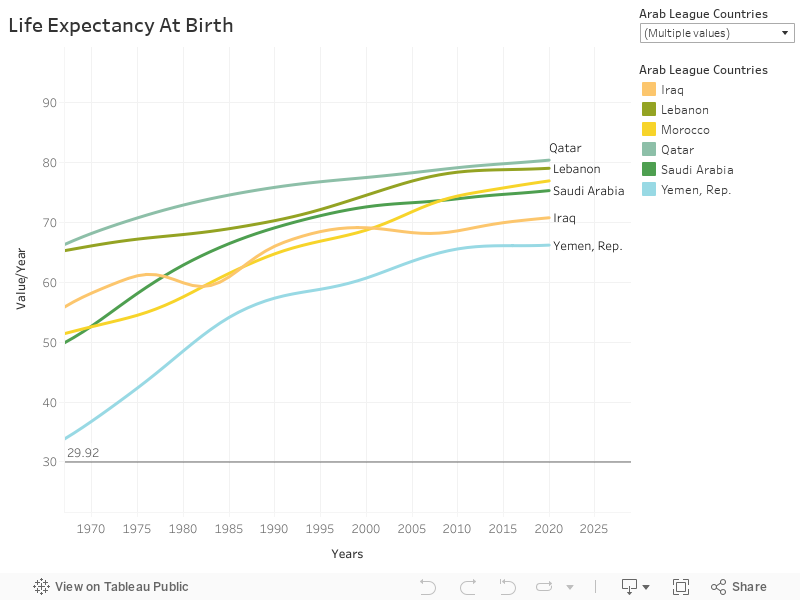
To further show the evidence of the impact of GDP and public health spending, we consider both indicators: Life Expectancy at Birth and Death Rate in the Arab League Countries.
Life Expectancy at Birth: we can that people from countries with high GDPs and high health expenditure per capita. Qatar leads the way with 80 years expected age in 2020 while Yemen has an expected age of 66 years in the same year.
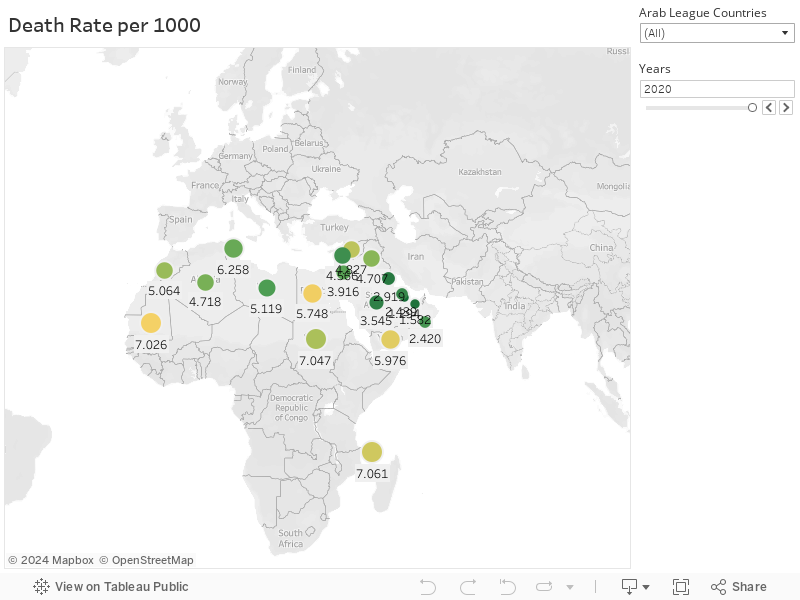
Death Rate: the same pattern seen with Life Expectancy is also seen in death rates per 1000 persons. Qatar has a death rate of 1.2 compared to Yemen which has a death rate of 5.9, both in 2020.
What should be done?
The United Nations Sustainable Development Goal #3 “Ensure healthy lives and promote well-being for all at all ages” points out the need for improving the public health of the world population. Health spending by governments is a very important factor in the health of their people. However, for those countries who are economically disadvantaged, improving health can be also achieved through:
Investing in education, especially in medicine studies to make sure the health sector has the competent doctors and specialists.
Directing international aid more towards developing health sectors in poor countries rather than urgent assistance.
Investing in awareness: one of the most important ways to improve health in developing countries is by educating citizens to take preventive healthcare measures and avoid riskier health behaviors.
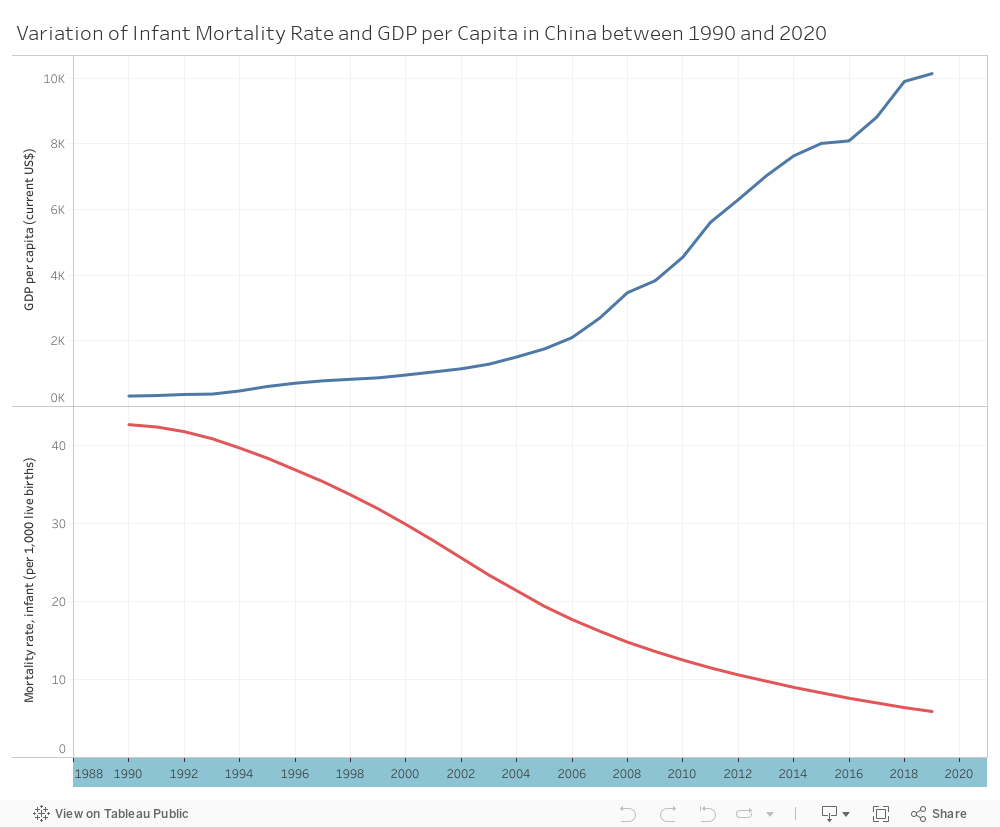
At the dawn of the 1990s, the People’s Republic of China was a typical developing nation. The majority of its population lived in poverty mainly in rural areas. The country’s GDP per capita was $318 which was almost equal to that of the African nation of Mali ($317) and much less than the GDP per capita of the South American nation of Guyana ($533.5). However, the most challenging problem that the Asian dragon faced was the high infant mortality rate of 42.7 deaths per 1000 births which was considered high according to UN standards (12 deaths/1000 births). Since then, the government implemented ambitious and bold economic reforms and opened gradually its economy to the rest of the world. The country witnessed an influx of foreign investment that resulted in the increase of the nation’s GDP per capita from $318 in 1990 to $10,144 in 2019! Beijing took advantage of its miraculous economic growth by incrementing investment in its health system. It focused on health financing, human resource development and health information systems and promoted the equalization of health services including maternal and child health services. As a result, the infant mortality rate in China decreased from 42.7 deaths/1000 births in 1990 to 5.9 deaths/1000 births in 2019. In other words, China triumphed in decreasing its infant mortality rate by 86% in almost 20 years, an achievement that even the most developed nations of the world did not accomplish. China is the example of a nation that has benefited from its economic development to decrease infant mortality rate. In this way, it achieved target 3.2 of the Sustainable Development Goals set by the United Nations for countries to reach by 2030 -the ending of preventable deaths of newborns to less than 12; and most importantly achieved the health and welfare of its population.
References:
Guo Y, Yin H. Reducing child mortality in China: successes and challenges. Lancet. 2016;387(10015):205-207. doi:10.1016/S0140-6736(15)00555-3
Department of Economics and Social Affairs, United Nations: Sustainable Development Goals, Goal 3: https://sdgs.un.org/goals/goal3