On paper, it was a success story. A flat red line that looked safe, predictable, and almost felt untouchable and unchangeable. But beneath that reassuring flatness laid a system that was quietly breaking apart.
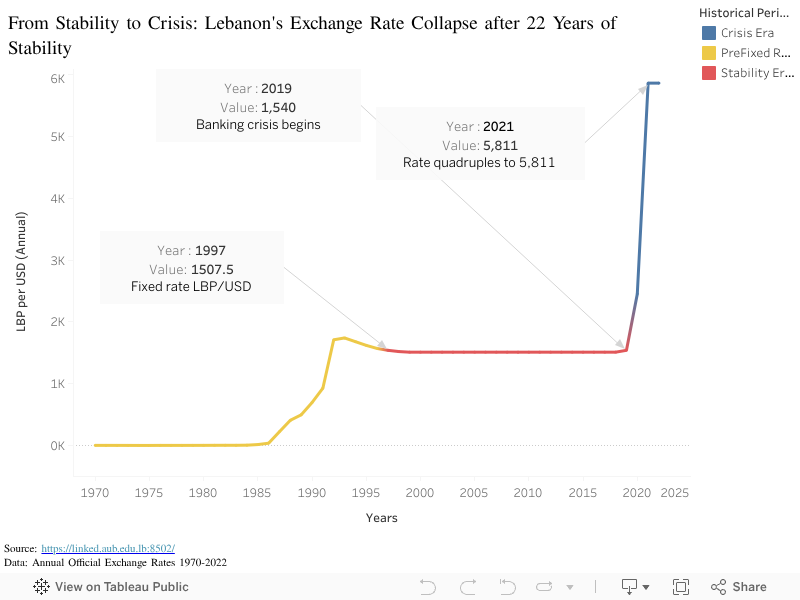
In this visualization, I trace the Lebanese pound (LBP) against the US dollar from the 1970s until today, splitting the story into three distinct eras: the Pre-Fixed Rate Era in yellow, the Stability Era with the official peg in red, and the Crisis Era in blue, where everything unraveled. The goal is not just to show numbers, but to reveal how a long period of apparent stability can mask growing fragility.
Before the peg: A fragile build-up (1970-1997)
The story starts in the 1970s and 1980s, shown in yellow. During this period, the Lebanese pound gradually weakens against the dollar. The line climbs steadily from near-flat values to over 1,500 LBP per USD by the mid-1990s.
What is important and alarming here is the direction of the climb: the Lebanese pound keeps losing value. There is no stability yet, only a slow, visible decline.
By 1997, the rate reaches 1,507.5, which becomes the famous official peg. That point is annotated on the chart because it marks a turning point: from moving exchange rate to a fixed one.
The illusion of stability (1997–2018)
From 1997 to 2018, the line turns red and becomes almost perfectly horizontal.
During those 22 years, the official rate stays pegged at 1,507.5 LBP per USD.
Visually, this flat line had been sending a powerful message which is “The currency is under control and Your money is safe.”
But a flat line doesn’t mean a healthy system. In fact, the opposite was happening. Behind that reassuring red line, public debt was climbing relentlessly. Budget deficits were widening. The entire economy had become dependent on fresh dollars flowing into the banking sector to maintain the illusion. The system was running on borrowed time and borrowed money.
The visualization deliberately keeps this middle section clean: one color, very few marks, a high data-ink ratio. The flatness is visually reassuring. And that’s precisely the problem. The chart shows us exactly what Lebanese citizens saw: a promise of stability that felt permanent. What it didn’t show is what couldn’t be seen in the numbers, was the invisible rot beneath the surface that was forming.
The collapse: 2019 onwards
The calm ends abruptly at 2019, marked with an annotation: “Banking crisis begins.” At first, the rate moves only slightly, from 1,507.5 to around 1,540 LBP per USD. A tiny change after decades of flatness. Barely noticeable.
But this small kink is the first visible crack. The system couldn’t hold.
From 2020 onwards, the line turns blue and shoots upward exponentially. By 2021, the value plummets to around 5,811 LBP per USD which is more than four times the official peg. The curve becomes nearly vertical, showing a visual representation of lost control and shattered trust. Instead of a slow, manageable depreciation, Lebanon experiences a collapse.
This is where the chart stops being just macroeconomics. Each point on that blue line isn’t an abstract number. It’s a family at the supermarket realizing their money buys half as much as last month. It’s a teacher whose salary, once stable, can barely cover rent. It’s life savings that quietly disappear, not because they were spent, but because their value evaporated overnight.
Insights:
What began as a flat, boring line became the steepest crisis in decades. The Lebanese pound went from appearing to be one of the world’s most stable currencies to becoming a cautionary tale of currency collapse.
The visualization tells us something important about systems, trust, and stability itself: a flat line maintained by freezing numbers rather than fixing underlying problems is not stability at all. It’s a mirage. And when mirages disappear, people lose more than just money—they lose faith in the institutions meant to protect them.
The real story isn’t in the numbers. It’s in what the numbers hide, and what happens when the hiding is no longer possible.
Maya is a young woman living in Lebanon who works hard and tries to plan for her future. But lately, her money no longer feels predictable. Prices change week to week, her salary loses value before the end of the month, and even simple decisions like buying groceries or saving feel uncertain. Her problem isn’t just inflation, it’s a loss of confidence in the currency she depends on every day.
What the Visualization Reveals
To understand Maya’s experience, I created a visualization of the Lebanese currency over time.
What we see in the graph is striking:
From 1972 to the mid-1980s, both lines are almost completely flat, showing a long period of predictability.
In 1987, the local currency suddenly rises from 6,457 to 22,638 in 1992 a clear collapse of confidence. The standard rate also increases during this time, but only slightly, reaching 1,741.
After 1992, both lines flatten again for nearly 20 years. The local currency stays around 22,000, while the standard rate stabilizes near 1,500, reflecting a period where trust slowly returned.
The biggest shift happens in 2020 the local currency jumps from 19,598 to 46,508, while the standard rate rises from 1,542 to 5,864.
This steep rise reflects the instability that defines Maya’s daily reality. Each spike represents a loss of confidence; each flat period reflects regained stability.
How We Restore Trust
The visualization shows that the solution is not only financial, it’s behavioral. To support people, we must rebuild predictability, stability, and trust. When the value of money becomes predictable, everyday stress decreases and people regain control over their financial decisions.
The data also proves that stability is possible. After the 1992 spike, the Lira stabilized for nearly two decades. Families were able to save, businesses planned long-term and confidence slowly returned. This demonstrates that rebuilding trust is achievable and when achieved, it transforms people’s ability to plan and move forward.
Rebuilding Trust for the Future
The key insight from Maya’s story is that currency value is not just an economic number; it reflects public confidence. When the line rises sharply, trust collapses. When it stabilizes, trust returns. Rebuilding confidence means reducing sudden shocks, increasing transparency, and helping people make long-term plans. Strengthening trust empowers people like Maya to regain control not only over their money, but over their futures.
In 2007, the world experienced a financial shockwave that originated from the U.S. housing market downturn. The crisis quickly rippled across global economies, with significant impacts felt in the U.S., U.K., and China. In this post, we’ll explore a comprehensive analysis of the crisis and the concerted policy responses that helped navigate these turbulent economic waters. Accompanied by insightful Tableau visualizations, we delve into the monetary and fiscal adjustments that shaped the path to recovery.
The Epicenter of the Crisis:
The 2007 financial crisis is a stark reminder of the interconnectedness of global markets. Starting in the U.S., the collapse of the housing bubble sent shockwaves that were felt in the U.K., a major financial hub, and China, the burgeoning economic powerhouse. The crisis highlighted vulnerabilities and sparked a global debate on economic safeguards. Our Tableau visualizations, which I’ll share throughout this post, bring to life the data behind these seismic economic shifts.
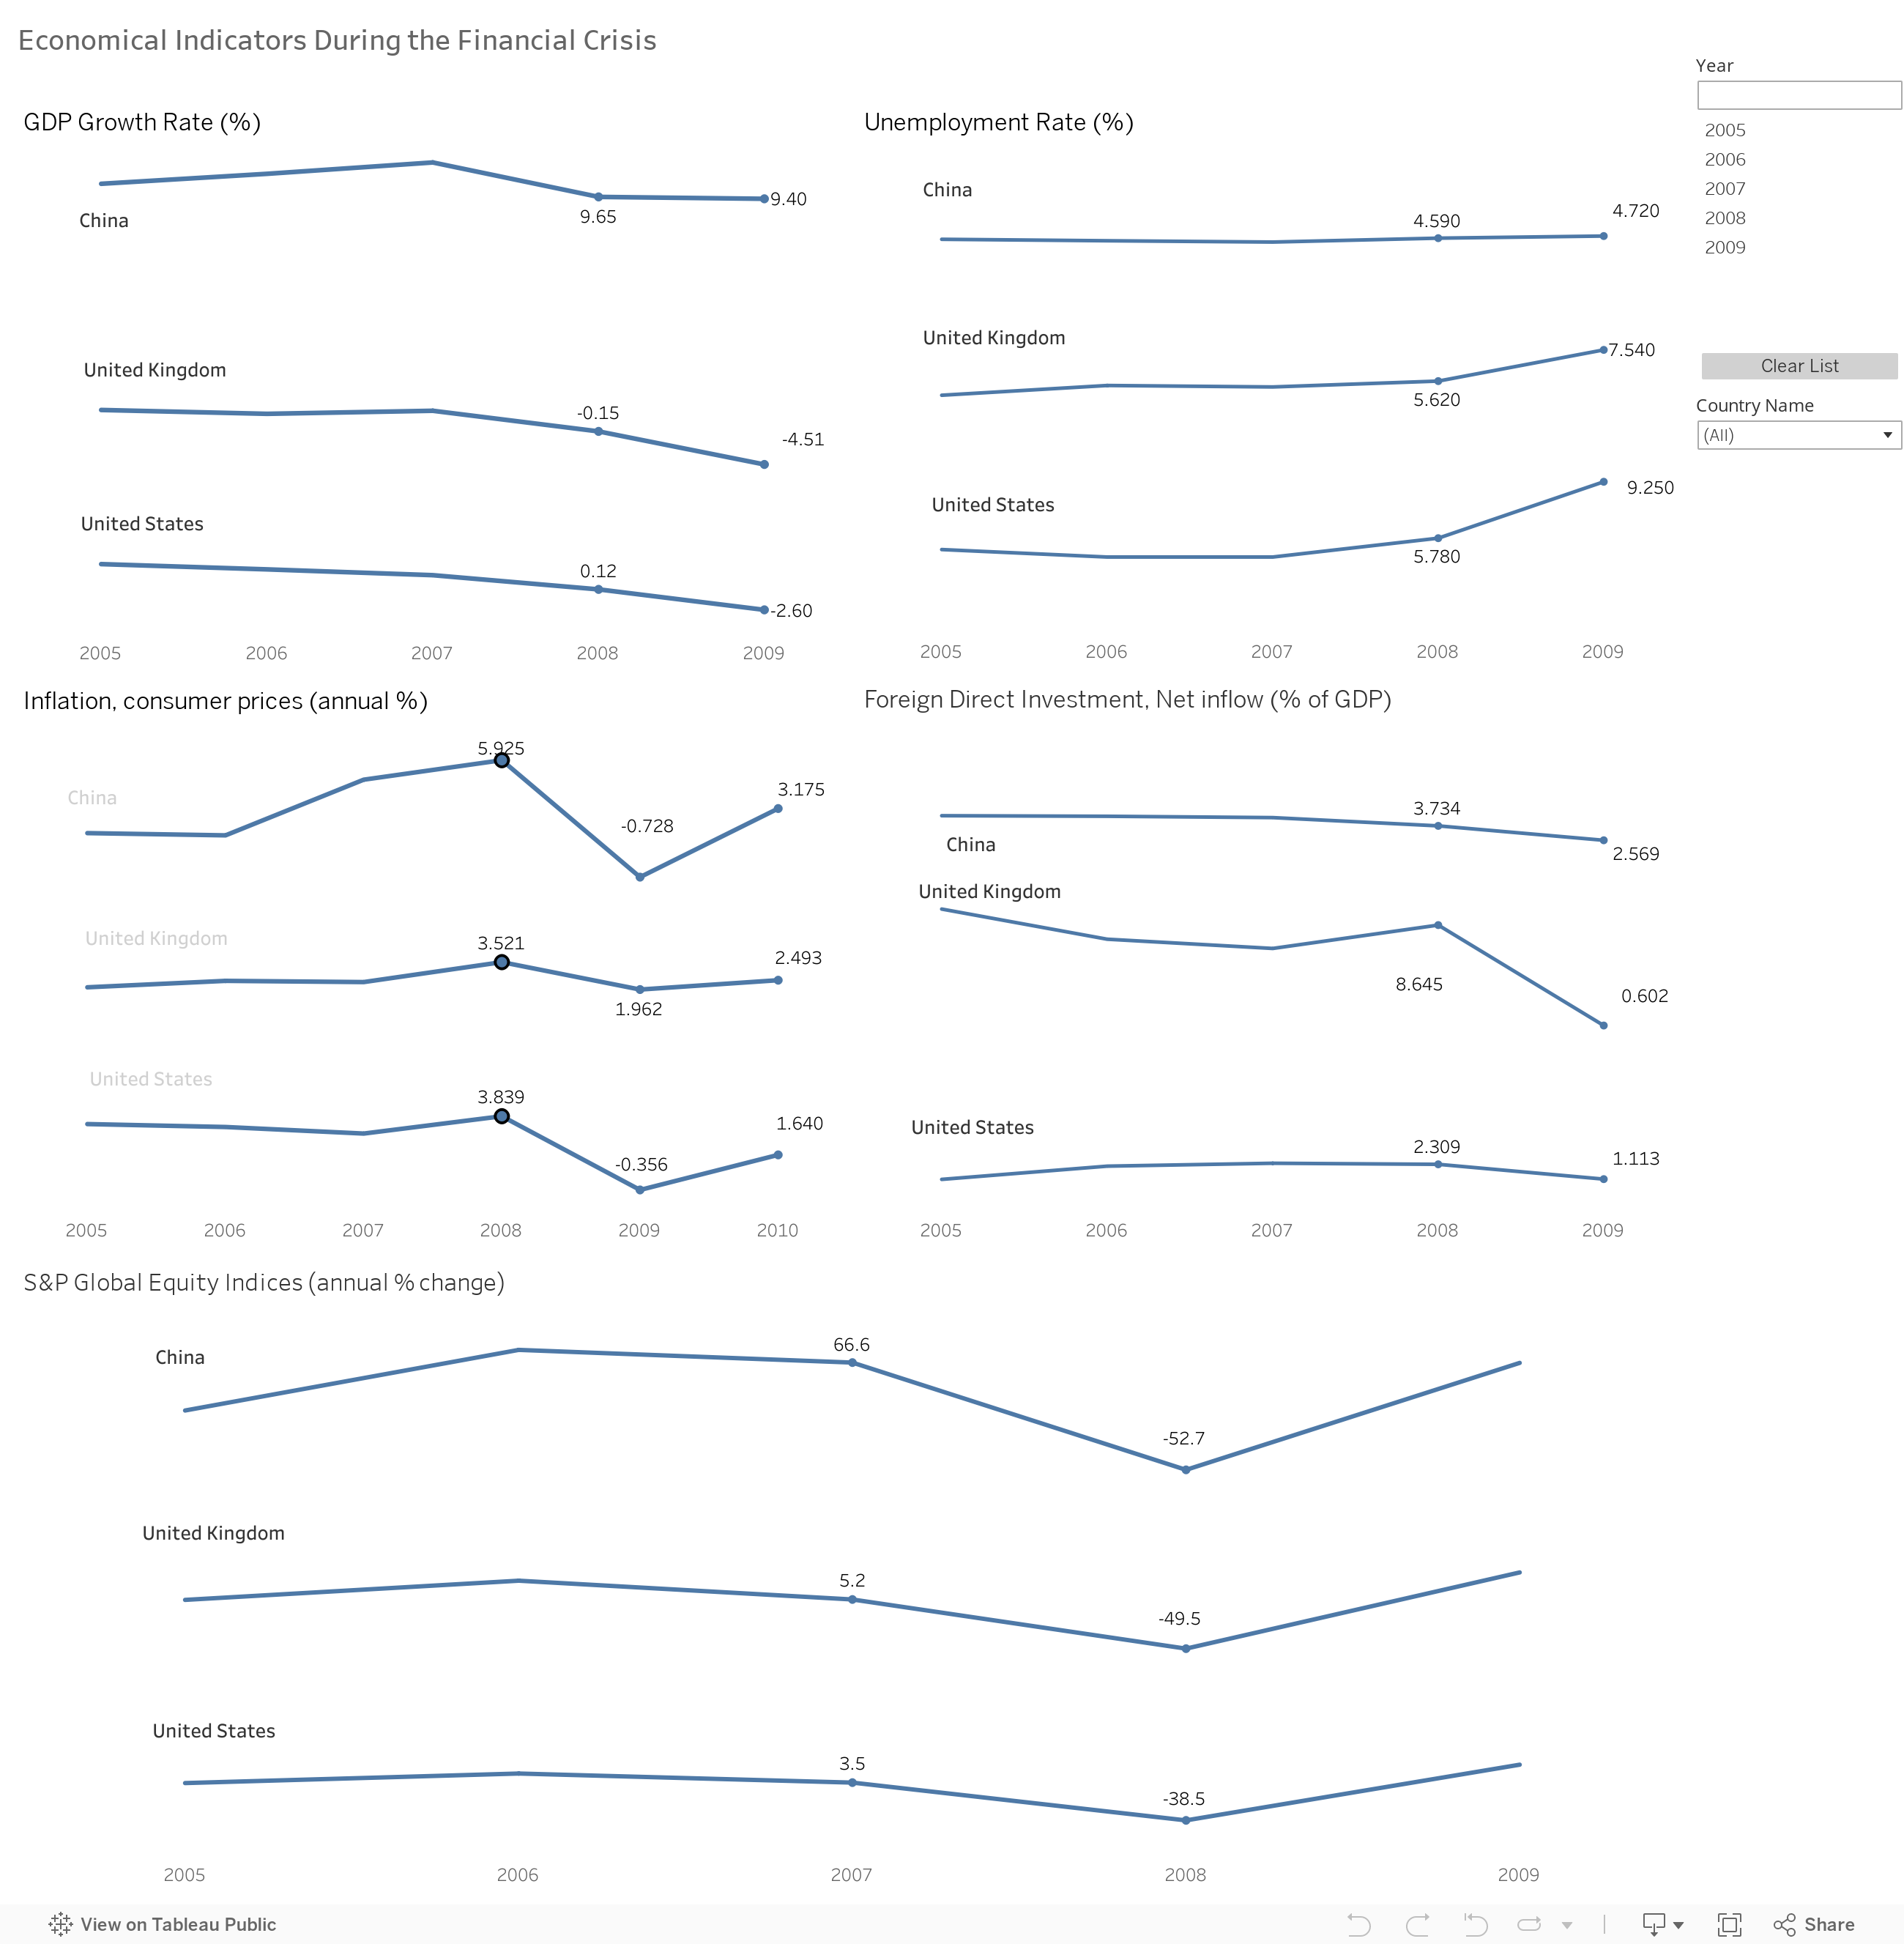
Economic Indicators in Turmoil:
GDP Growth Rate: The severe downturn in the U.S. and UK economies in 2009, with GDP growth plummeting to -2.60% and -4.51%, respectively, signified deep recessions. China’s maintenance of a 9.40% growth rate, despite a global slowdown, demonstrated the effectiveness of its economic policies and a less interconnected reliance on global financial systems.
Unemployment: The dramatic rise in U.S. unemployment to 9.25% in 2009 mirrored the harsh reality of the economic crisis’s impact on the labor market. The UK’s unemployment rate’s more moderate increase to 7.54% indicated a resilient but strained job market. China’s steady unemployment rate suggested a controlled labor environment, possibly cushioned by government-led initiatives.
Inflation and Deflation: The pivot to deflation in the U.S. and China in 2009 highlighted the breadth of the economic contraction, marked by plummeting consumer demand. The UK’s decreasing inflation rate, from its 2008 peak, nonetheless remained positive, reflecting persistent cost pressures despite a contracting economy.
Investor Sentiment and Market Response:
FDI: The UK’s steep decline in FDI following the crisis suggested capital flight and a significant erosion of economic confidence, a contrast to the U.S.’s more stable investment climate. China’s gradual FDI decline mirrored the broader cautious stance of global investors during the period of uncertainty.
Equity Markets: The UK and U.S. equity markets’ deep dives of -49.5% and -38.5% in 2008, along with China’s -52.7% plunge, captured the panic and rapid revaluation of future earnings potential, significantly affecting wealth and spending.
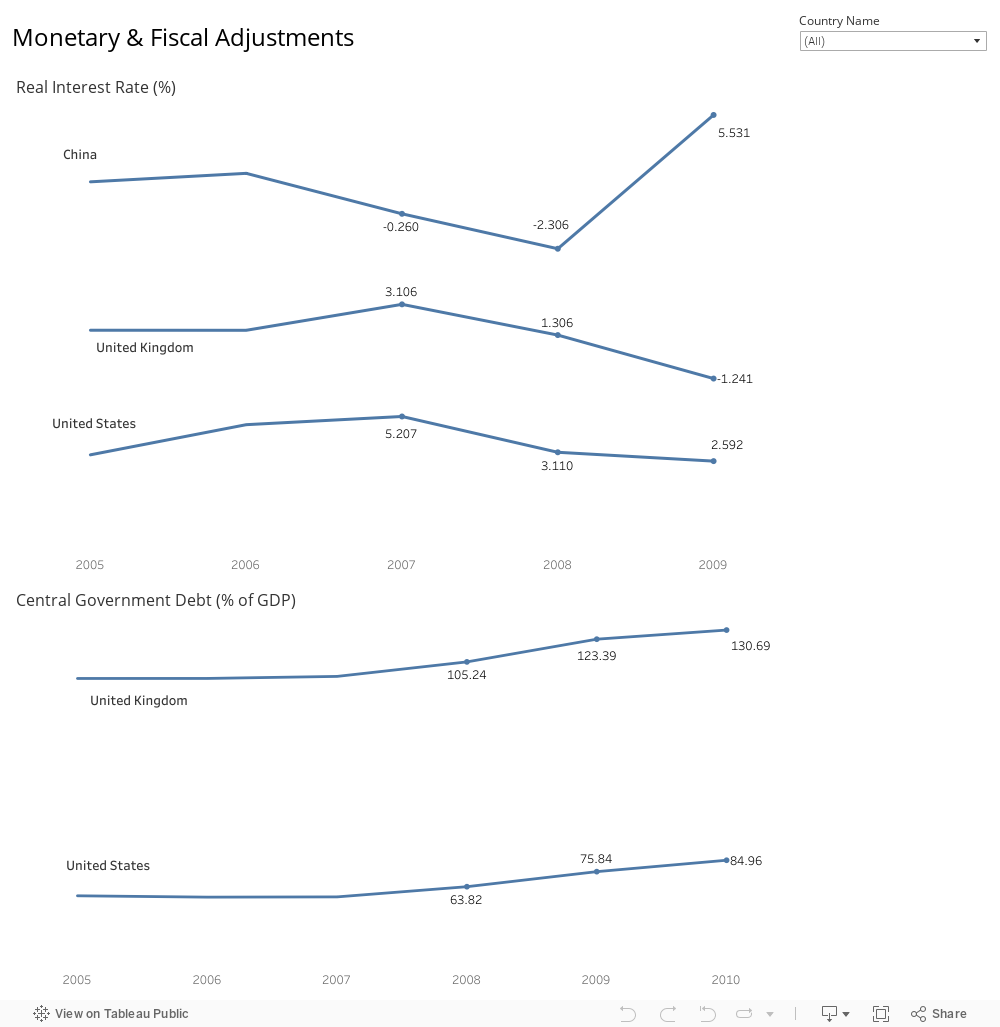
Monetary & Fiscal Adjustments: Navigating Through Economic Turbulence
The global financial crisis of 2007-2008 forced countries to reevaluate their monetary and fiscal strategies. Central banks across the world slashed interest rates, while governments ramped up borrowing to inject liquidity and stimulate economic activity. The graphs provided offer a glimpse into how China, the United Kingdom, and the United States adjusted their policies in the face of economic headwinds.
Monetary Policy Adjustments: A Dive into Negative Real Interest Rates
In response to the financial crisis, China, the UK, and the US adopted aggressive monetary policies, including steering real interest rates into negative territory to encourage borrowing and investment. This is particularly evident in 2009’s negative real interest rates.
China responded to the crisis by lowering its real interest rates from -0.260 in 2007 to -2.306 in 2008, indicating a decisive move to encourage spending and investment.
The UK followed a similar path, with real interest rates dropping from 3.106 in 2007 to -1.241 in 2009, reflecting a substantial monetary stimulus.
The US saw its real interest rates decrease from 5.207% in 2007 to 2.592 in 2009, as part of its strategy to revive the economy.
Fiscal Stimulus: The Path of Increased Government Debt
The fiscal response to the crisis was marked by an increase in government debt, as seen in the upward trend of central government debt relative to GDP. This increase is indicative of a commitment to boost economic activity through government spending.
The UK’s central government debt rose sharply from 93.63% in 2007 to 130.69% in 2010, a clear sign of significant fiscal intervention.
The US also saw its government debt climb from 63.82% in 2007 to 84.96% in 2010, as it took on more debt to stabilize the economy.
For China, although not displayed on the graph, the World Bank and IMF data show an increase in central government debt from 16.4% in 2007 to 33.5% in 2010, demonstrating China’s use of fiscal policy to maintain economic momentum.
Analyzing the Impact of Policy Adjustments on Economic Indicators:
Following these adjustments, we look at how they influenced key economic indicators. The equity markets in all three countries showed signs of recovery in 2010, with China’s market increasing by 8.2%, the UK’s by 12.8%, and the US’s by 13.6%. Such improvements in the equity markets typically reflect greater investor confidence, potentially buoyed by lower interest rates making equities more attractive compared to fixed-income assets.
In terms of foreign direct investment (FDI), there was a noticeable uptick in all three countries. China’s FDI as a percentage of GDP went up by 55.9%, the UK’s by an impressive 345.2%, and the US’s by 57.7%. The growth in FDI highlights the global improvement in investor sentiment and market confidence, likely influenced by the monetary easing and fiscal stimulus measures.
As for GDP growth, all three countries experienced positive changes. China continued its robust growth; the UK and the US both rebounded from negative growth rates in 2009 to positive rates in 2010. These changes underscore the effectiveness of the stimulus efforts, which aimed to encourage borrowing, spending, and overall economic activity.
Findings and Recommendations:
The economic data from the 2007-2008 financial crisis reveal that while aggressive monetary easing and fiscal stimulus were critical in mitigating the downturn, the recovery trajectory varied significantly across nations. The U.S. and the UK, with deep contractions in GDP and spiking unemployment, required robust policy responses to revive consumer confidence and stabilize financial markets. On the other hand, China’s proactive fiscal measures, particularly in infrastructure, helped sustain its economic momentum. Our findings suggest that future crises may demand even more nuanced and sector-specific policy interventions. For instance, targeted support for small businesses and industries most affected by a downturn could provide a more efficient path to recovery. Additionally, policies aimed directly at consumers, such as mortgage relief programs, could prevent a cascade of defaults and stabilize the housing market more rapidly. A collaborative international response, leveraging the strengths of interdependent global economies, could amplify the efficacy of such measures. Therefore, we recommend a framework for economic policy that emphasizes flexibility, targeted support, and global coordination to not only cushion against immediate shocks but also to lay the groundwork for sustainable, long-term growth.
Conclusion: Steering Through Economic Adversity
The financial crisis that shook the foundations of global economies in 2007-2008 also brought to light the critical role of proactive monetary and fiscal policies in navigating economic adversity. The United States, the United Kingdom, and China each faced unique challenges and responded with tailored strategies that reflected their economic philosophies and priorities. Despite the varied approaches, the shared objective was clear: to stabilize the financial system, stimulate growth, and restore confidence. The recovery of equity markets, the resurgence of foreign direct investment, and the gradual uptick in GDP growth by 2010 are a testament to the effectiveness of these interventions. This period of economic recalibration provided valuable insights into the intricate dance between government policy and economic health, insights that continue to shape economic strategies in our increasingly interconnected world.
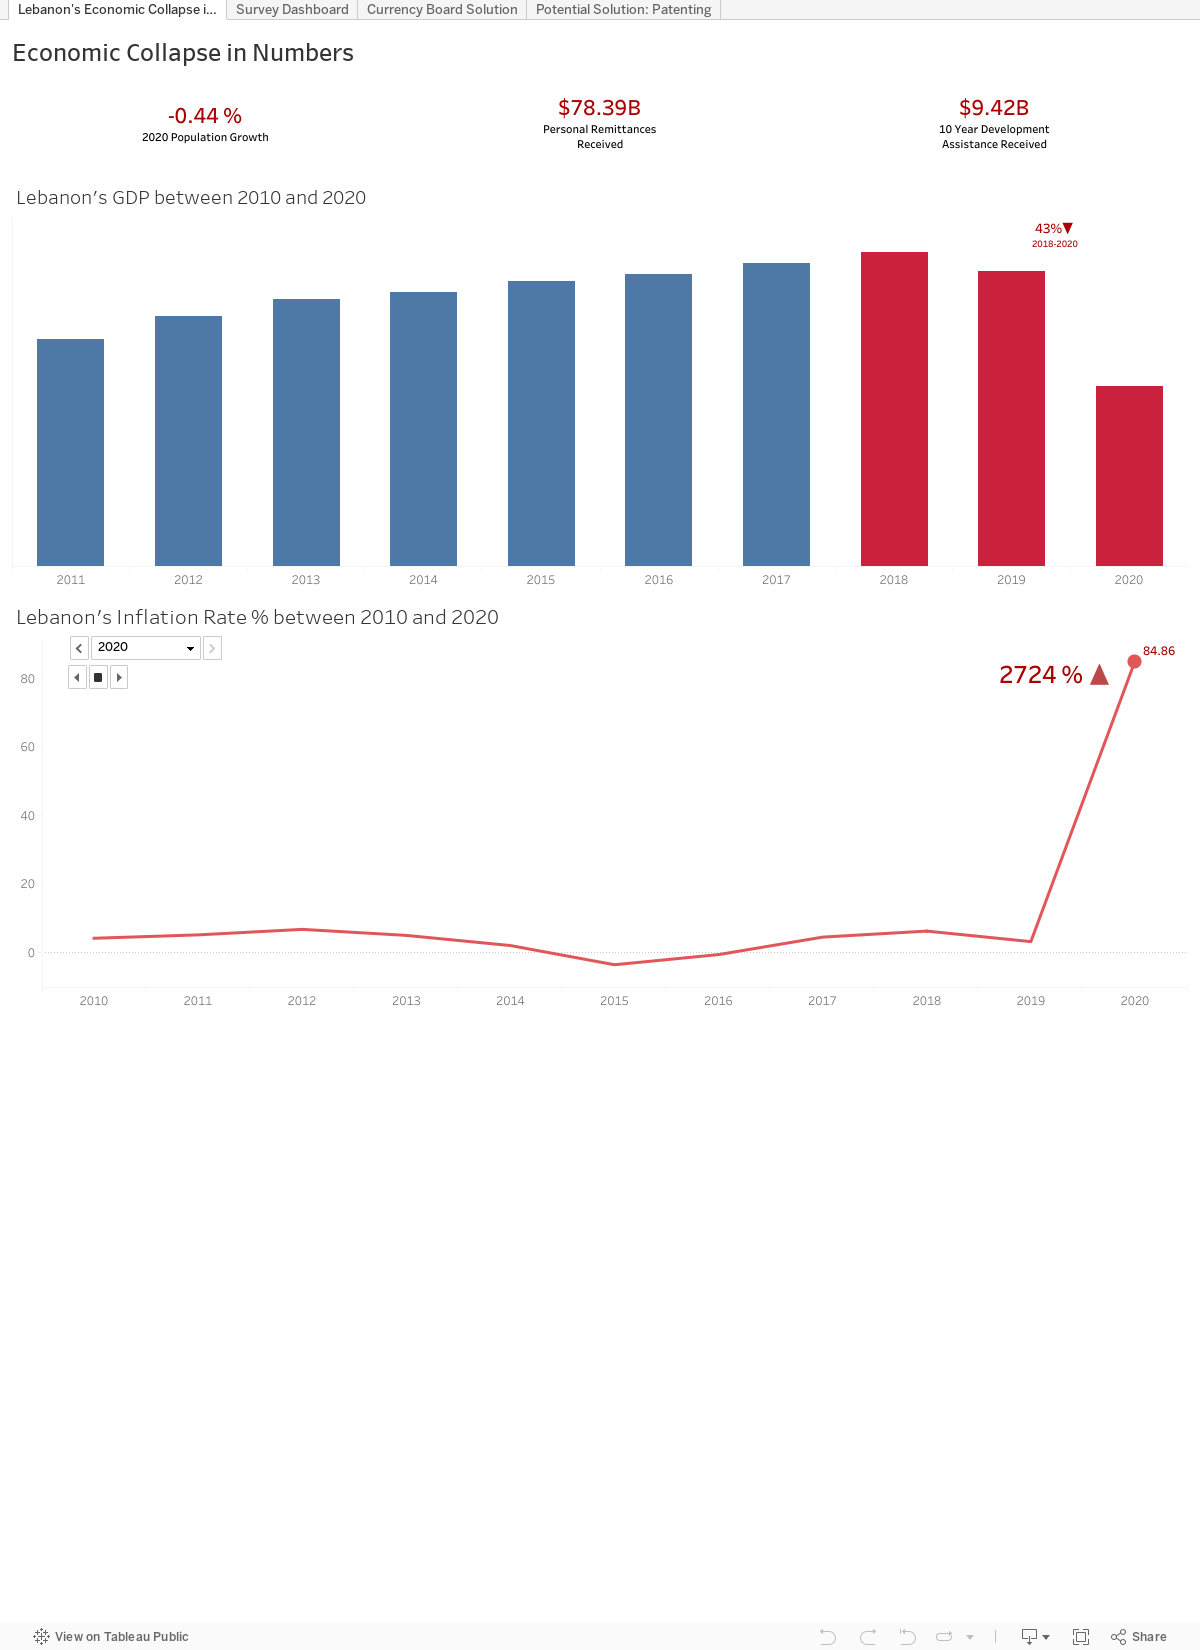
Lebanon has been living one of the worst economic crises that a country has lived in the modern era. According to the World Bank , it is likely to rank among the top 10 most severe crises experienced globally since the 1850s. In this article, we will explore the impact of Lebanon’s economic collapse on the mental health of the Lebanese people, their productivity, and their forecasts of the country’s future. We will also try to discuss two potential measures that could mitigate its severe economic crisis.
The following graphs plotted in the dashboard were based on the UN World Indicators dataset. These graphs reflect the severity of the Lebanese collapse. The bar chart of Lebanon’s GDP per capital for the last ten years demonstrates that the country’s GDP has shrunk by 43% in two years only! To make things worse, the inflation rate line chart show that the country’s inflation rate has skyrocketed by 2724% in two years only! An item that cost 1000LBP in 2018 cost almost 27,240 LBP in 2020! For further details refer to the “Lebanon’s Economic Collapse in Numbers” dashboard.
These shocking numbers have motivated us to study the effect of the economic collapse on the Lebanese people’s mental health and productivity in addition to explore their insights about the future. Therefore, we designed a survey in which 370 people of different age and employment groups participated. The results were extremely alarming: 61% of the surveyed people said that their mental health was affected by the economic collapse while almost 60% of them revealed the negative impact of the crisis on their productivity. To make things worse, 69% of the respondents said that they wanted to leave Lebanon while 62% of them were pessimistic about the country’s future! Almost 1 in every 5 Lebanese said that there is no hope in Lebanon. On the other hand, almost half of the respondents said they would stay in Lebanon if the situation improved. The “Survey Dashboard” summarizes the survey’s results.
The Currency Board:
As Lebanon’s economy has been in crisis for almost two years now, ranked in possibly the top three most severe economic and financial crises since the nineteenth century, an ultimate solution does exist but is nearly impossible to achieve, replacing the ruling political parties. As ambitious young minds, we looked for practical solutions that we can possibly push for to help our country. A suggested solution from an economic perspective would be a currency board, a solution that has been implemented in countries that were facing a similar crisis to Lebanon such as Lithuania and Bolivia. A currency board is an entity separated from the central bank that is given the authority of managing the country’s currency reserves and fixing exchanges rates, it is regulated by law and not the government, hence limiting any pressure from political parties. Having a currency board would fix the inflation rate and trigger a domino effect on the economy by improving GDP, growth, and many other factors.
The “Currency Board Solution” dashboard below shows that there is a prompt decrease in the inflation rate after applying the currency board solution in the late 90s in Bulgaria, Estonia, and Lithuania, who’ve faced severe cases of hyperinflation just like Lebanon. Alongside the stability of the inflation rate over 20 years, GDP has shown a steady increase since the setup of the board as a result of inflation being stabilized. This shows how this solution has an immediate impact and could help Lebanon start the recovery process directly.
Obtaining then Commercializing IP to boost GDP:
Another solution for Lebanon’s current problem is obtaining then commercializing intellectual property; Given Lebanon’s rich human capital this seems like a reasonable solution. Also, by patenting Lebanon’s ideas, they can offset copycat competitors thus preserving Lebanon’s newly found income source, for a reasonable timeframe [till the patent expires]. Some of the metrics to measure a country’s participation in intellectual properties, at least from the World Bank World Development Indicator dataset are:
– Patent application, residents and Patent application, non-residents
o These were summed to a new metric: Patent Applications, Total
– Industrial design applications, resident by count and Industrial design applications, nonresident by count
o These too were summed to a new metric: Industrial design applications (Total)
– Trademark applications total
o No summing of several metrics was needed here
Besides generating high-value, and off-setting copycat competitors, plenty of the high-value wages in many fields are not energy-intensive; for instance, consider the designers of the iPhone package boxes at the Apple headquarters; these box designers literally sit in a room designing carton boxes, and these designers make more money than the overseas employees working in the energy-intensive factory manufacturing these boxes. This is a model that Lebanon who has high creativity but is experiencing an energy shortage can pursue.
And as the “Potential Solution: Patenting” dashboard demonstrates, we’re able to see that these three Intellectual property metrics are positively-correlated with GDP – so it is something that we believe Lebanon as a society should consider as a route to follow.
Conclusion:
To conclude, it is true that Lebanon’s economic crisis has merged us into a dark tunnel from which it is not easy to get out of. However, with conscientious diligent ethical work, we can accelerate the recovery process. At the end, it is in our hands to decide whether we shall stay this obscure tunnel for a long time or encounter the light of salvation at its end as fast as possible.