In today’s world, the intersection of environmental health and economic development is more crucial than ever. A deep dive into global data reveals a powerful link between CO2 emissions, mortality rates, access to clean fuels and technologies, and women’s empowerment. These factors work together in influencing health outcomes and shaping sustainable futures for communities across different regions.
Exploring the Data: The Link Between CO2 Emissions and Mortality Rates
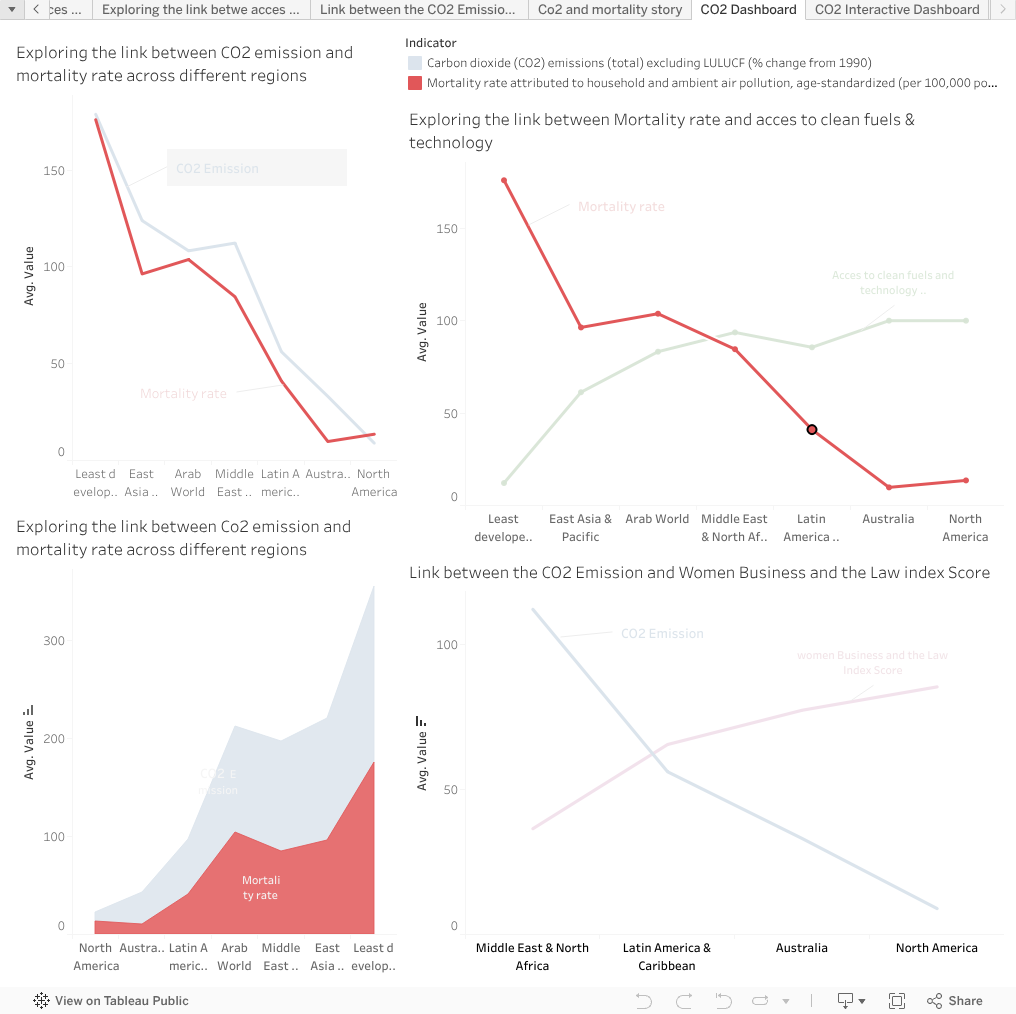
The graphs shown in the dashboard above illustrate how CO2 emissions are closely tied to mortality rates. Regions with higher CO2 emissions tend to experience higher mortality rates, primarily due to poor air quality and the associated health risks. For example, the Least developed countries, East Asia & Pacific, and the Middle East & North Africa show the highest levels of CO2 emissions, correlating with elevated mortality rates. This data raises a critical question: How can we reduce CO2 emissions to save lives?
Access to Clean Fuels and Technology: A Game Changer
Another significant factor in improving mortality rates is access to clean fuels and technologies. In regions where there is greater access to renewable energy sources, such as wind and solar power, the mortality rates tend to be lower. This is because cleaner energy options reduce harmful emissions and promote healthier environments. As seen in the chart, Australia and North America have made strides in improving access to cleaner energy, which contributes to healthier populations.
Women’s Empowerment: A Hidden Key to Progress
Perhaps the most surprising link in this data is the relationship between women’s empowerment, business & law index scores, and environmental outcomes. The graph shows that some regions where women have more opportunities in business and law tend to have lower CO2 emissions. This suggests that when women are empowered to make decisions in the business and policy sectors, it can lead to better environmental policies and practices, ultimately reducing CO2 emissions and improving public health. The data indicates that empowering women is not just a moral imperative but an essential component of tackling climate change and improving health outcomes.
Conclusion:
These findings are clear: reducing CO2 emissions, increasing access to clean energy, and empowering women are not isolated goals—they are interconnected. By addressing these issues together, we can create a more sustainable and healthier world for everyone. The data shown in the charts serves as a wake-up call to policymakers and business leaders that creating a cleaner, more equitable future is not only necessary but possible.
NB: To explore the latest updates on indicators, click on them to access the WHO indicators main page for detailed insights.
Believe it or not, climate change may prevent us from enjoying many of our favorite meals in the next years. Some crops may go extinct, while others may become scarce and expensive. Who does not enjoy chocolate? The cocoa plant may be completely wiped out by 2050. Who doesn’t drink coffee in the morning? By 2100, 50% of the land will be unsuitable to grow coffee. Human activities have been the primary cause of climate change due to burning fossil fuels.
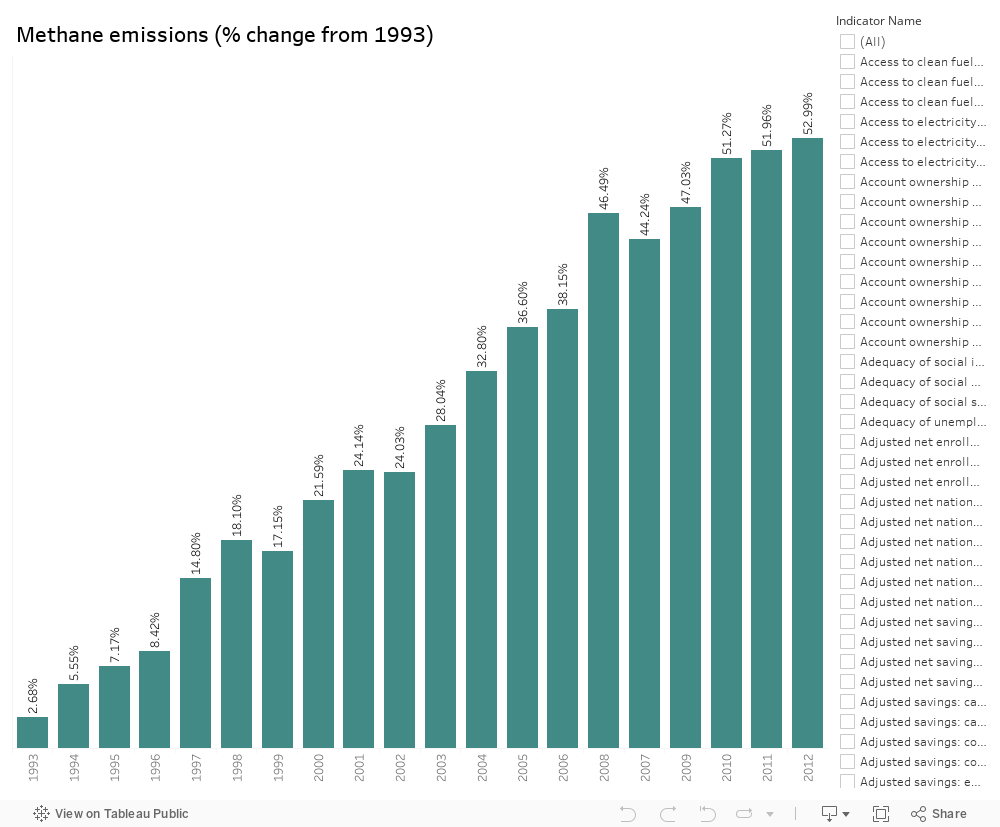
When fossil fuels are burnt, significant amount of greenhouse gases are released into the atmosphere and these gases trap heat in our atmosphere and contribute to global warming. Methane is greenhouse gas that is responsible for around 30% of the rise in global temperatures and as you can see, methane emission has increased rapidly over the years all around the globe.
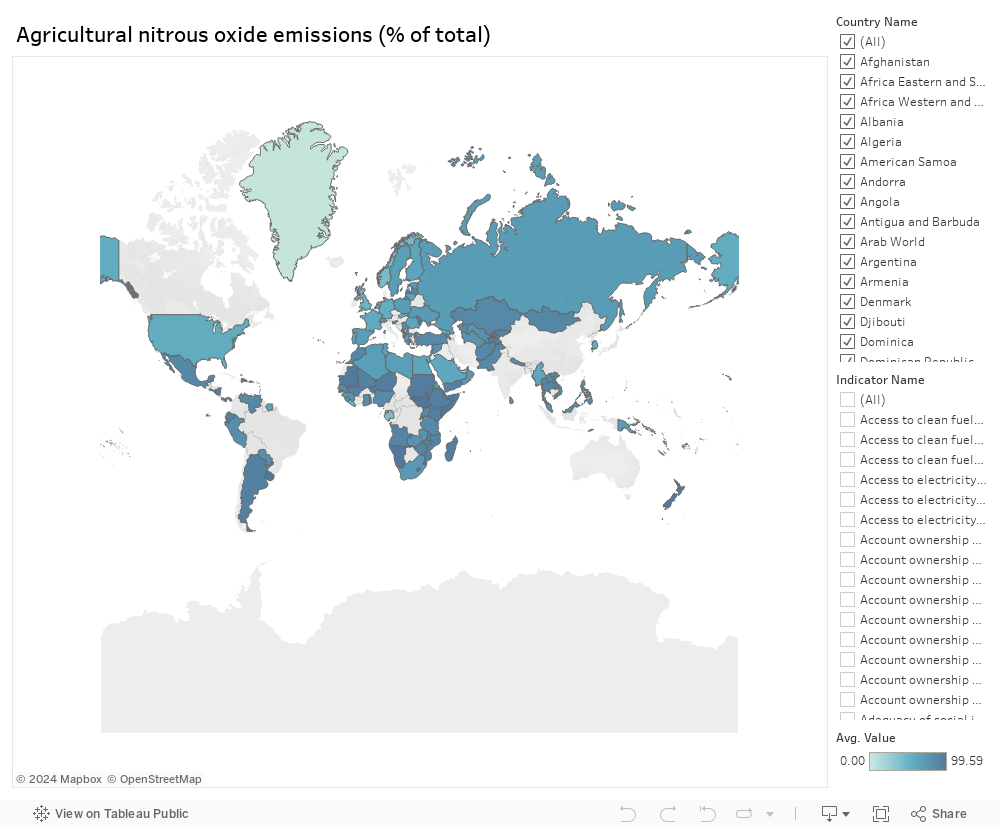
Nitrous oxide is the third most major greenhouse gas, accounting for around 7% of global warming. Coffee production has declined mostly as a result of rising yearly temperatures in coffee-producing countries such as Brazil, Vietnam, Indonesia, and Colombia. This map visualizes the precent of Nitrous Oxide, the darker the color, the higher the percentage.
There is no planet B, so we shouldn’t need another reason to act and try to prevent climate change from getting worse or risk the extinction of our favorite food. The question is, what can we do? We start from ourselves. There are a lot of things that we can do as individuals to help in reducing climate change effect. We should work on generating electricity from wind, solar and other renewable sources, as opposed to fossil fuels, which emits little to no greenhouse gases or pollutants into the air. We can also help by following the rule of reduce, reuse, repair, and recycle in our everyday activities. We can also pay attention to throwaway less food, save more energy, and speak up about the issue to raise awareness.
What else can be done? Some coffee beans generally grown in hotter climates, and we should investigate more about and encourage farmers it to plant more of it in the future. We can also develop technologies to enable the adaptation of coffee production to future climatic change conditions. One of the initiatives being pursued by scientists at the University of California is to utilize new technology to help the plant survive. The team at Berkeley is working with the Mars company on gene-editing technology, to help the plant to survive in the uncertain years to come.
In 2020, emissions fell by 5.8 percent due to COVID-19 and the resulting economic crisis. Therefore, our individual efforts count, and we can make a difference!
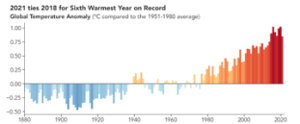
Year after Year, temperatures rise across the world with an increase in the overall emissions of CO2 and other gases correlated with global warming. Sea levels are at risk of rising, climate change is on the rise, increased risks of droughts and floods and threats to biodiversity. All this as a consequence of global warming and finally putting people’s lives at risk and the survival of the world. Although we have a solution available, we are not efficiently relying on it neither optimizing its use. SDG 7 requires a world responsibility towards providing accessible and clean energy sources, one of our key responsibilities is to ensure that we reach this goal adequately by the year 2030.
“Amount of CO2 in the atmosphere is 50% more than the 1900s.”
“Temperatures increasing yearly, and summers getting hotter.”
These are words repeated by people over and over, but are we reacting?
The following shows the rise in temperatures.
Global Warming:
The root problem!
Global warming was identified as a global issue during the 1980s, during the year 1988 world hottest summers were recorded. Since then, hotter summers have been recorded, increasing temperatures are still being recorded along continuous increase in CO2 and greenhouse gas emissions. Renewable energy was first explored in 1927 through wind turbines, although such resources are available, they are still not used adequately to encounter the rising temperatures issue. Renewable energy resources are available, but their usage is not improving.
Renewable Energy:
Are we sufficiently using them?
World resources institute states that renewable energy resources emit 50g or less of CO2 emissions per KWh over their lifetime, compared to about 1000g CO2/KWh for coal and 475g CO2/KWh for natural gas.
Renewable and clean energy resources such as solar power, wind power, hydro power or nuclear power are highly available and further resources could be developed. Current resources are not efficiently used along with no clear plans or transition to more clean energy resources. On the other hand, not all countries or people have appropriate access to clean energy resource neither the resources or accommodations required to develop them.
The infrastructure and development of renewable energy is highly costly, but costs for using such energy on the long-term are cheaper, current fossil fuel prices are set to be cheaper as the pollution consequences and carbon-fee are not interpreted into the pricing strategy of gases and fossil fuels. Governments and Organizations are avoiding the transition due to its high costs but at the cost of polluting and putting high risks on our environment our health and survival of earth.
A clear rise in CO2 emissions accompanied by a decrease of renewable energy consumption is shown and identified by world development indicators.
Actions Required:
Optimizing usage of currently available clean energy resources and services.
Increase the availability of clean energy sources and reliance on them across different sectors and industries.
Raise Awareness on the problem “that we have the resources and capabilities needed to reduce global warming” but we are not efficiently using them.
Raise Awareness about the risks and effects of global warming along with the quick rate it is happening at.
Governments and World organizations planning strategies to increase the use of renewable enerygy and conducting awareness campaigns to influence the public and future image.
If we don’t protect our environment and nature, we can’t protect ourselves. Floods, drought, higher rates of contamination, increased health risks and the slow death of our planet are the cost of using cheaper resources.
Climate change is the biggest threat to our planet. It is both the easiest and the most challenging issue we have ever faced. The easiest because we know what we must do. The hardest because our current economics are still totally dependent on burning fossil fuels, thereby destroying ecosystems to create everlasting economic growth.
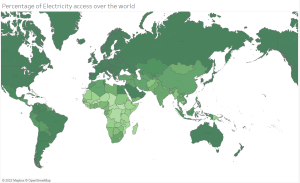
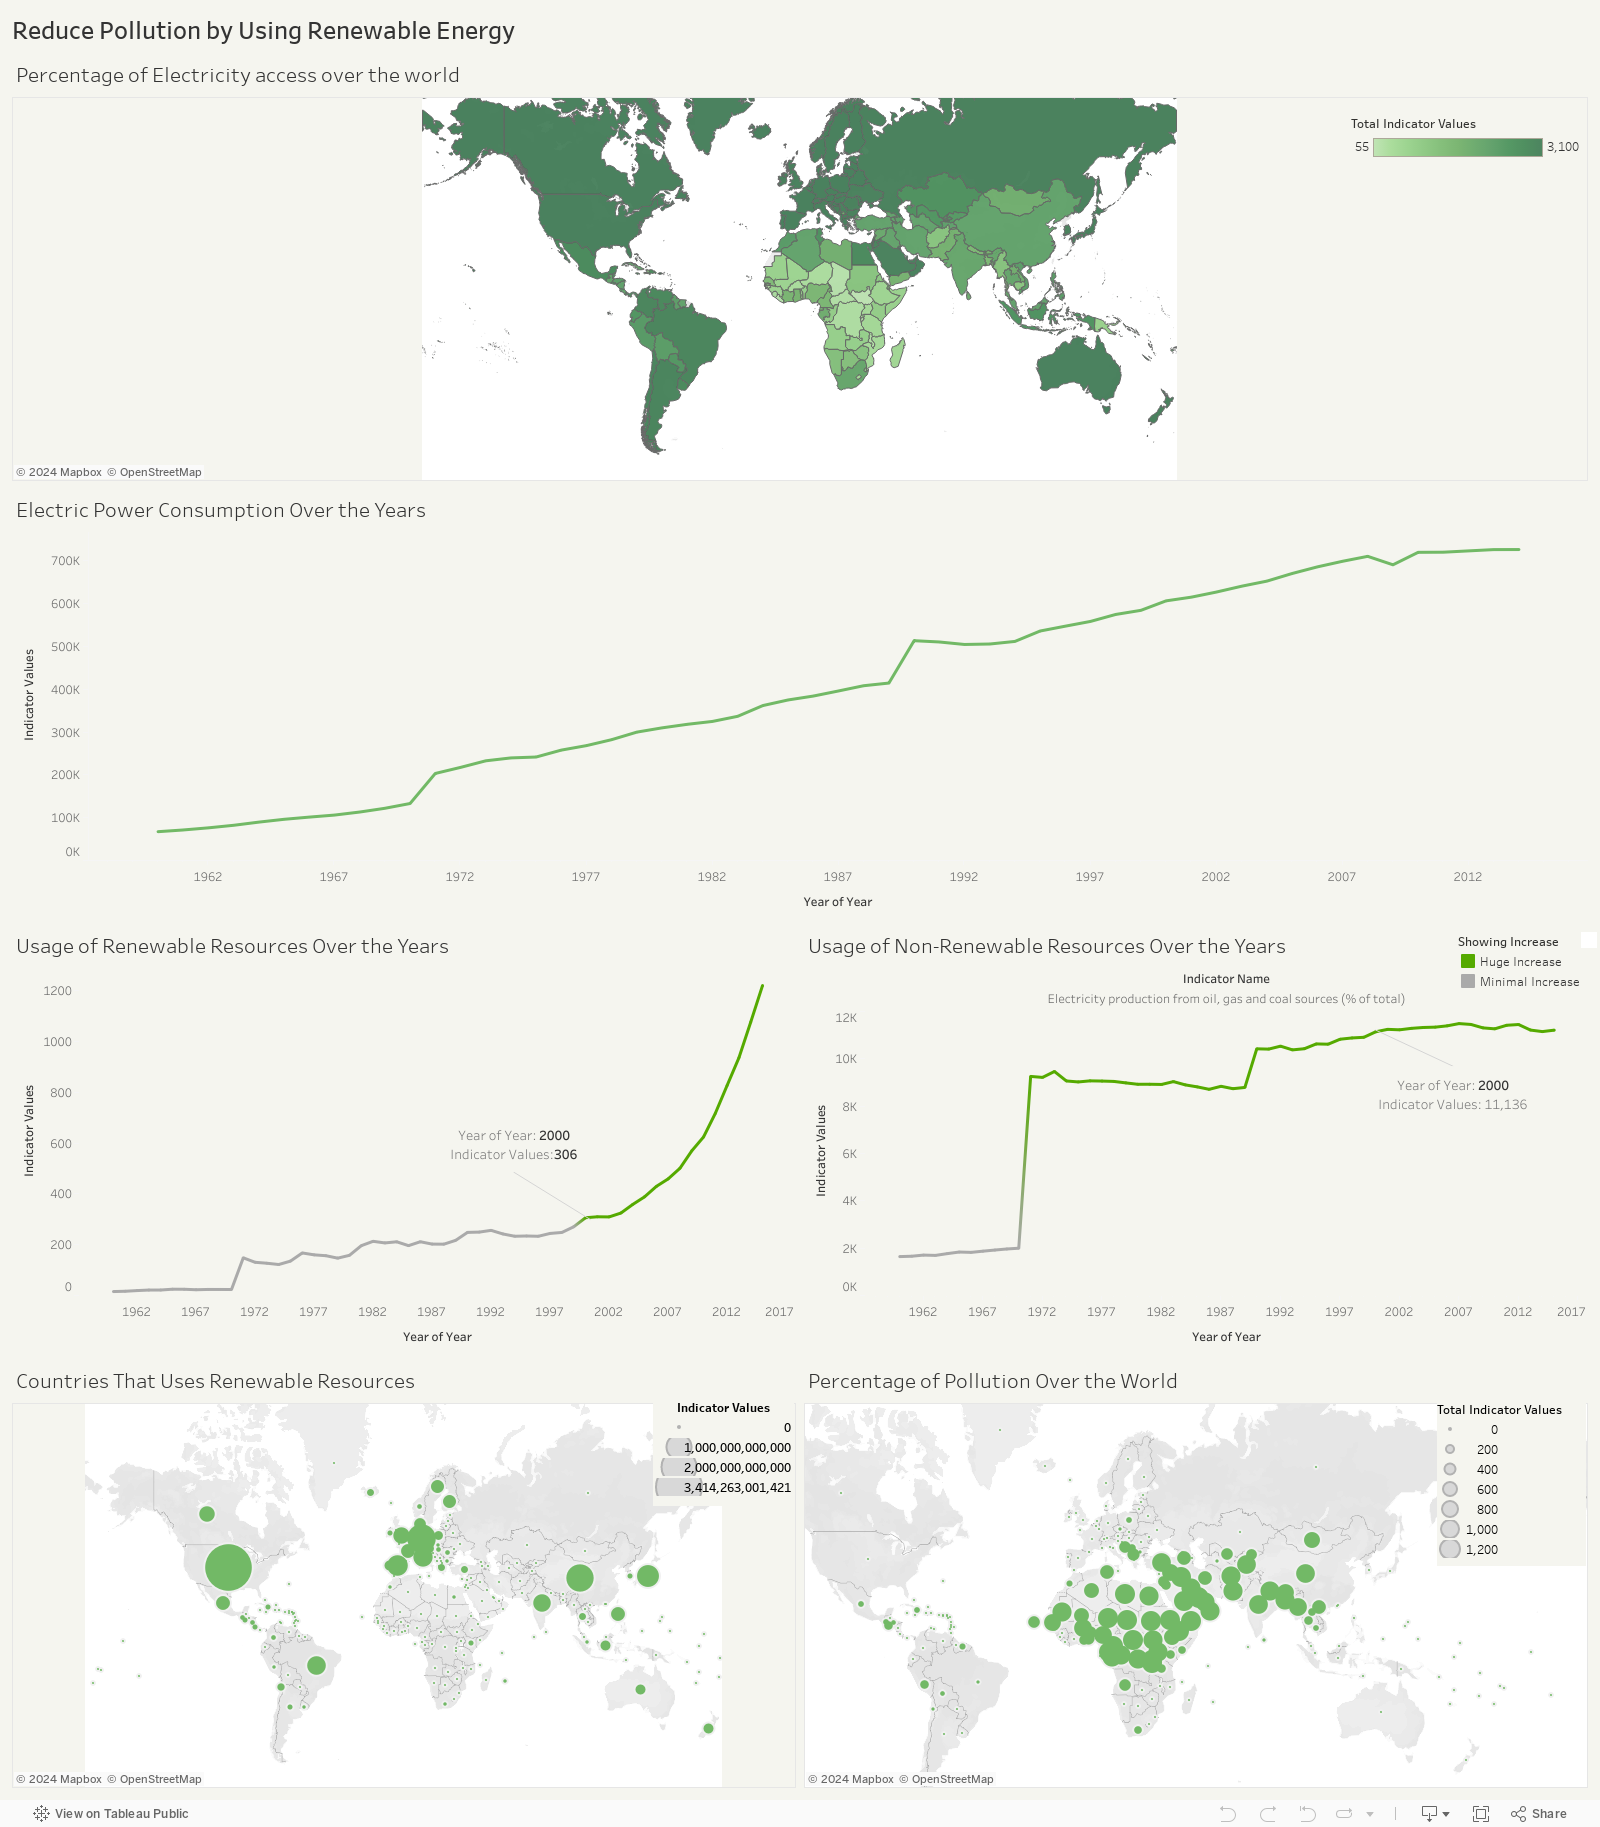
Although there are still some countries like Africa doesn’t have total access to electricity.
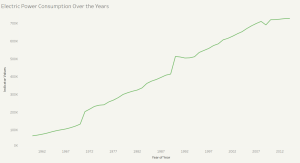
Over the years, electricity consumption has increased tremendously.
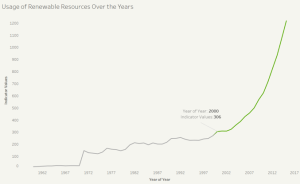
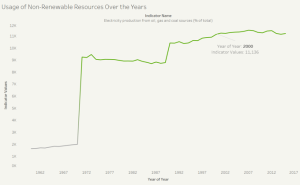
So did the usage of renewable resources has also increased, but not enough compared to non-renewable resources.
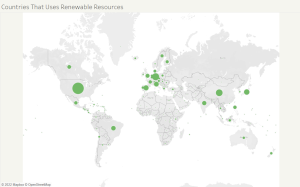
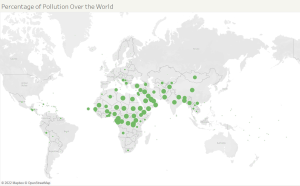
It has been 10 years since top voice influencers and climate justice activists, United States presidents, and tech enthusiast CEOs were trying to fight climate change. It is known that the key to tackling the climate change crisis is to end our reliance on non-renewable energy. So, what if we try to use renewable energy for electricity? Can this reduce climate change? Can it avoid using CO2 Emissions, fuel, oil, and gas? We studied and visualized data of countries that used renewable energy and how it affected their environmental pollution compared to others that used non-renewable energy like fuel, oil, and gas. We found that developed countries that were using renewable energy had less ecological pollution by 70% approximately than countries that weren’t using renewable energy.
This descriptive statistical measure demonstrates the huge success of the use of renewable sources of energy to reduce pollution and diminish climate change. Remember there is no planet B. We live in one mother earth; we must protect it.
It is proven that the use of renewable sources of energy decreases the amount of pollution which reduces climate change and, because of this we recommend that the countries should make use of their hydropower, ocean power, wind, and solar energy for electricity and minimize the use of non-renewable energy.
2022. Climate change. DROUGHT. Increasing DROUGHT periods. Shorter Time Between these DROUGHT periods. FAMINE.
Meet Zahi. Zahi is a 10 year old Somali boy who lives in Somalia. He has been suffering from acute malnourishment for a good while now.
In fact, as of 2022, it was reported that around 4.1 Million Somalis are just like Zahi: all acutely malnourished, or even severely malnourished. In other words, this means that 1/4th of the Somali population is at the very least acutely malnourished. What can that cause, you may ask? Illnesses, poor physical and cognitive development, and ultimately, death.
This makes Somalia the hungriest country in the world. If you are wondering how hunger is measured, it is by using a metric entitled the Global Hunger Index (GHI). The latter is calculated by gathering data about:
Undernourishment: share of people in a given region/country whose caloric intake is deemed insufficient,
Child Undernutrition: share of children under 5 who have low weight for their height (wasted children) and thus suffer from acute undernutrition, but also the share of children under 5 who have a low height for their age (stunted children)- which indicates chronic undernutrition,
Child Mortality: mortality rate of children under 5 who die because of inadequate nutrition and unhealthy environments.
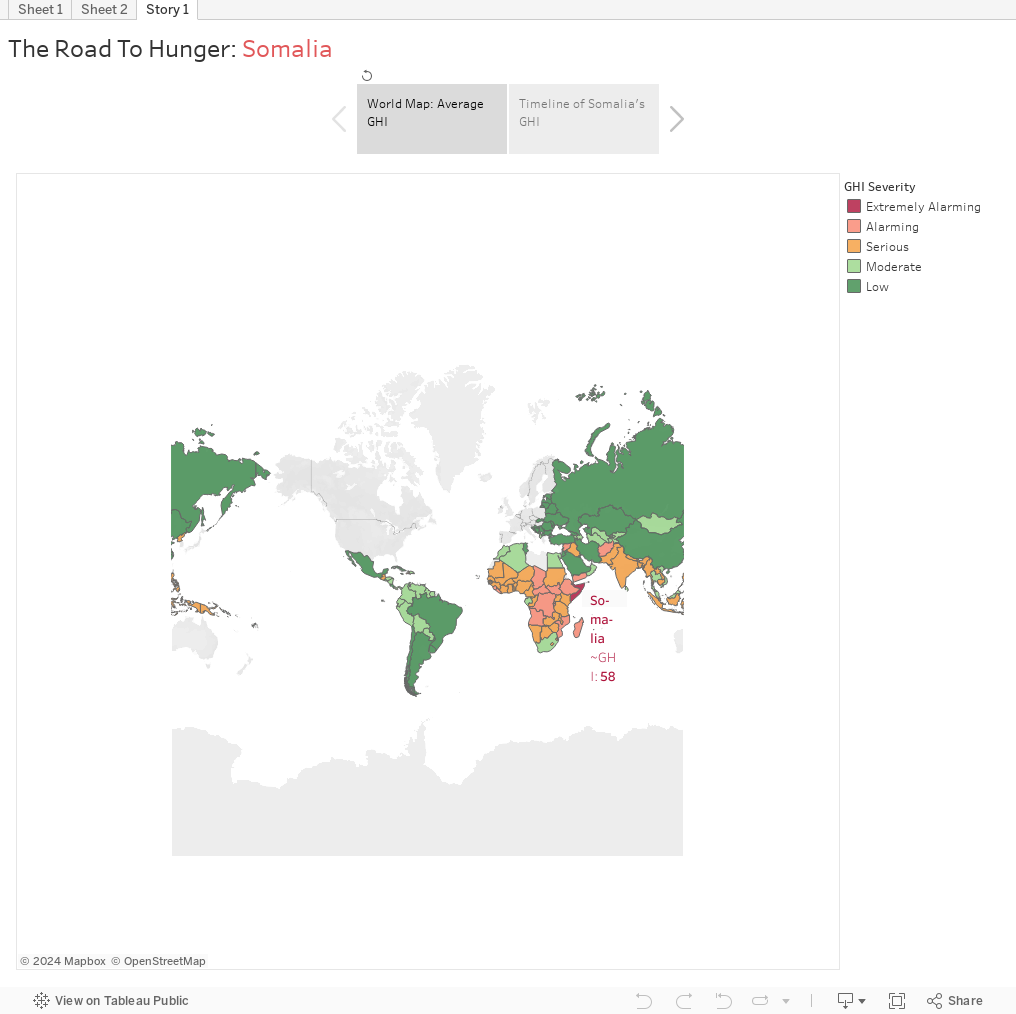
To visualize the world’s hunger, the map that can be viewed in Sheet 1 below or on this link has been created.
We notice that Somalia is indeed the only country in the world with an extremely alarming Global Hunger Index, with an average GHI of 58 over the past 20 years.
What makes the situation in Somalia this dire and helpless? Well, to say the least, poverty coupled with and aggravated by governmental corruption, several outbreaks (to list a few: cholera, malaria, measles, corona), inflating prices (notably with the current Russia-Ukraine crisis) and most importantly the series of drought periods that have been happening consecutively over the past years, with the 2011-2012, 2016-2017 and 2021-2022 crises counting as the 3 major and most recent drought crises that have happened (and are still happening). Moreover, drought means death of livestock, no water, parents abstaining from eating to feed their children the very little food they have access to, and overall hunger. One must note that droughts have always happened in Somalia (and in the Horn of Africa generally), meaning that the Somalis are used to drought, and they had adapted to it, knowing how to pick themselves up and continue. However, with climate change, these drought periods have become more acute and consecutive, with shorter periods separating them, hence disabling Somalis from the chance to recover from the last drought.
Alright, now what is the solution?
The deployment of an immediate humanitarian response: gathering funds through non-governmental organizations or even governmental donations which aim (but are not limited to) to sending emergency water supplies, sending food donations, treating the malnourished, distributing dietary supplements, opening and running health supplies but also giving out cash and livelihood support to those who are most in need.
Does this help?
Yes. It does.
As a matter of fact, just like the graph on Sheet 2 below shows (or the one you can see on this link), in 2012, Somalia’s GHI was measured at an all time high of 65. Thanks to the donations and the humanitarian responses that happened between 2011 and 2020, Somalia’s GHI dropped to 50.8. Magical, right? Arguably the GHI all time high of 65 could have been prevented in the 2011-2012 drought crisis had the international scene acted quicker than they did: in fact their response was so slow that thousands had died by the time aids reached. It was indeed deemed a failure. Moreover, back then only 56% of the UN’s funding appeal for Somalia were met by donors, whereas during the 2016-2017 drought crisis, the international scene responded quicker and more acutely, with 68% of UN’s funding appeal for Somalia being met by donors.
However, it is to be noted than today, in the ongoing 2021-2022 drought crisis, merely 2.3% of the UN’s total funding appeal for Somalia have been met by donors. 2.3%. Furthermore, according to Mohamud Mohamed, Save the Children’s Country Director in Somalia: “Donors have a narrow window to prevent a major humanitarian disaster in Somalia (…)We’re worried that the political environment globally is overshadowing the humanitarian suffering of the Somali people.” As Mohamed said, the eyes of the world are focused on Ukraine, and are overlooking the rest of the world. Unequal treatment kills.