Despite being a landlocked nation with limited natural resources, Rwanda has never allowed geography to define its trajectory. What the country lacks in ocean access, it makes up for through innovation, resilience, and strategic vision. Over the years, Rwanda has built a global reputation for producing exceptional Arabica coffee, world-class tea, and premium horticulture products — commodities that have become symbols of national pride and economic progress.
As regional integration deepens and global demand for high-quality agricultural products grows, Rwanda stands at a pivotal moment. Unlocking the next phase of growth requires understanding where Rwanda exports, what it exports, and how this export structure can be strengthened to reduce dependence on costly imports.
Asia emerges as Rwanda’s most influential export region in 2024, driven largely by strong demand for the country’s premium agricultural products. Within this region, the United Arab Emirates stands out as Rwanda’s top export destination, reflecting deep commercial ties and the UAE’s role as both a high-value consumer market and a major re-export hub for African goods.
Regional neighbors like DR Congo, and global partners such as China, the UK, Belgium, and the United States, further reinforce Rwanda’s diversified export footprint.
Rwanda’s commodity breakdown reveals that the largest export category “Other commodities & transactions” is driven by its main export products: coffee and tea. These crops are not just exports; they are economic pillars that support hundreds of thousands of families and define Rwanda’s global identity.
Rwanda’s hillsides produce some of the world’s most sought-after Arabica coffee, while its highlands cultivate premium, award-winning tea. Yet most of these products are exported raw, meaning Rwanda captures only a fraction of their true value.
In 2024, Rwanda imported 2.7 times more than it exported, driven primarily by machinery, fuel, industrial materials, and manufactured goods — sectors where Rwanda still relies heavily on international supply chains.
From Agricultural Strength to Industrial Power
Rwanda has already demonstrated what is possible when challenges become strengths. Its coffee, tea, and horticultural exports have carried the nation’s identity to global markets. The next phase is about scaling that success into broader, sustainable economic transformation.
The path forward is clear:
Invest in value-added processing to capture more income from coffee, tea, and horticulture.
Strengthen local manufacturing to reduce dependence on high-cost import.
Expand regional trade to anchor Rwanda’s export presence in fast-growing African markets.
Attract investors into agro-processing, packaging, logistics, and local manufacturing.
Rwanda has the products, the markets, and the momentum.
The next chapter is simple: capture more value at home and convert export strength into national prosperity.
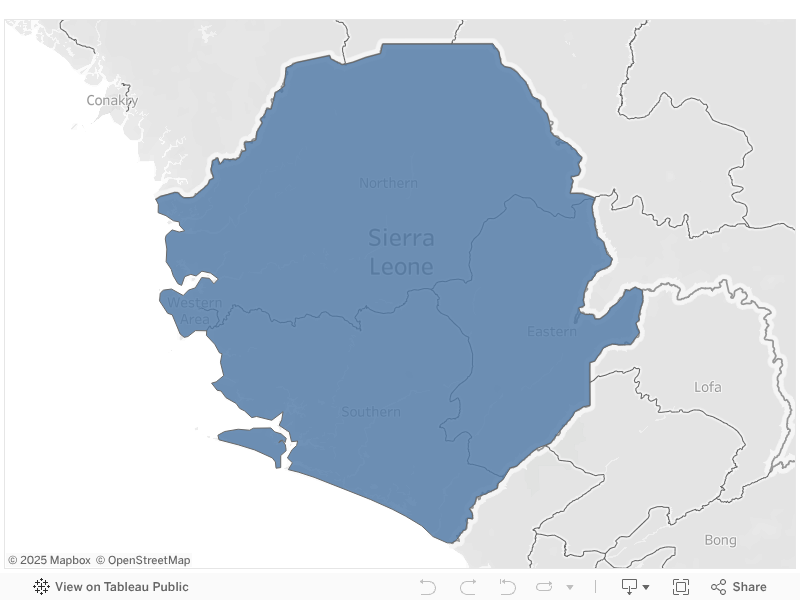
Sierra Leone is a small West African nation with a population of roughly 8 million people. Rich in natural beauty, cultural energy, and abundant resources. But behind the country’s potential lies a familiar struggle: an economy still leaning too heavily on a single sector. Agriculture has long been the backbone of national productivity, while mining, industry, and services often struggle to keep pace.
This structural imbalance has made Sierra Leone vulnerable, and nowhere was this more visible than in 2015, when the dual shocks of the Ebola outbreak and a collapse in global iron ore prices sent the economy into a tailspin. So, what exactly is going on beneath the surface? And what would it take to build a more resilient and diverse economy?
Agriculture consistently accounts for 50-63% of the GDP, leaving the nation vulnerable whenever farming seasons fail, prices fluctuate, or crises occur.
Industry is the most unstable sector, swinging wildly between 5% and 22%. And in 2015, it hit its lowest point, just 5% due to:
The Ebola outbreak froze movement and production.
A crash in global iron ore prices is forcing mining operations to shut down.
This year alone has exposed how dependent Sierra Leone’s industrial sector is on external forces.
Hovering between 28–36%, the services sector has been steady but sluggish, unable to compensate for weaknesses elsewhere. Together, these patterns reveal an economy that struggles to withstand shocks because it lacks balance.
A Way Forward: Building a Diversified Economy
If Sierra Leone wants long-term stability, it must diversify, plain and simple. That means:
Strengthening industry
Modernizing agriculture with value addition
Expanding services and digital innovation
The proposed solutions are supported by real-world programs in Sierra Leone, confirming their credibility and feasibility.
World Bank – Sierra Leone Economic Diversification Project
Supports economic diversification beyond agriculture and mining.
Strengthens SMEs, enhances value addition, and improves market access.
Confirms agro-processing, service expansion, and SME support as national priorities.
International Labour Organization – Opportunity Salone Programme
Promotes youth entrepreneurship and job creation.
Supports sustainable SME models and value chain development.
Validates the focus on integrating agriculture with industry.
The solutions are evidence-based, nationally aligned, partner-friendly, and feasible. But the question remains: how can Sierra Leone leverage these programs and data insights to fully unlock its economic potential?
In Lebanon, access to healthcare can change drastically with geography. A person in Tripoli can find a clinic or pharmacy on nearly every corner, while someone in Hermel or Zahleh might travel hours for the same care.
Using data obtained from the AUB Linked Open Data Portal, I explored how healthcare facilities are distributed across more than 1,100 Lebanese towns. The goal was to understand whether medical services are spread evenly across the country or concentrated in only a few locations.
Uneven Access Across Towns
The data reveals a clear imbalance. Healthcare services are heavily centralized in urban areas, particularly Tripoli, Saida, and Haret Hreik, which together host the largest share of Lebanon’s medical facilities.
Tripoli alone has more than 230 healthcare establishments, while dozens of smaller towns have fewer than 20 facilities, and some have none at all.
This concentration means that people living in rural and inland areas often need to travel long distances for even basic medical services, while urban hospitals and clinics struggle with overcrowding and high patient loads.
It highlights a system where location determines opportunity, where healthcare is available not based on need, but on proximity to major cities.
What Kinds of Facilities Exist?
When we look at the types of healthcare facilities, pharmacies and clinics dominate the landscape. They make up the majority of Lebanon’s healthcare infrastructure, far outnumbering hospitals and specialized centers.
While pharmacies and small clinics ensure access to medication and consultations, hospitals and diagnostic centers are much fewer, especially outside major cities. This shows a healthcare system that leans more on treatment through medication than on preventive or emergency care.
Balancing the Map: How Geography Shapes Access
Together, these findings reveal how geography continues to shape healthcare opportunities in Lebanon. The concentration of facilities in urban centers not only affects access but also contributes to inequalities in health outcomes. Urban residents have quicker access to doctors, specialists, and emergency units, while rural populations often rely on limited local clinics or travel hours to reach adequate care.
These patterns underline the urgent need for balanced healthcare investment. Rural areas require new clinics, laboratories, and emergency units that bring services closer to people’s homes. Improving healthcare equity is not only a matter of infrastructure, it’s about ensuring that every Lebanese citizen, regardless of location, can access timely, reliable care.
Final Reflection
This analysis shows how data visualization can make inequality visible. By mapping and quantifying healthcare access, we can move beyond perception and use data to guide smarter, fairer policy decisions. Ultimately, every dataset tells a story, and in this one, the message is clear:
“Health should not depend on your zip code.”
Tags: healthcare, Lebanon, inequality, data visualization, open data, AUB
Children’s Survival Shouldn’t Depend on Where They Are Born
Over the past 25 years, the world has made great progress in reducing child mortality. However, millions of children still die before their fifth birthday. The main reason is where they are born and the economic status of their countries and families.
Children born in wealthier nations have a much higher chance of survival than those in poverty, conflict zones, or rural areas. While some low-income countries like Bangladesh, Ethiopia, and Rwanda have made significant progress, others like Somalia, Niger, and Chad continue to struggle.
The Reality of Child Mortality in 2022 4.9 million children under five died, mostly from preventable causes.
5 countries with the highest under-five mortality rates:
1- Niger
2- Nigeria
3- Somalia
4- Chad
5- Sierra Leone
5 countries with the lowest under-five mortality rates:
1- Iceland
2- Japan
3- Norway
4- Singapore
5- Estonia
These numbers highlight a widening gap-low-income and fragile states are falling behind.
Global Progress in Reducing Under-Five Mortality
Since 1990, the global under-five mortality rate has dropped by more than 50%. However, progress has been uneven. Children in Sub-Saharan Africa and South Asia still face the highest risk of early death. A child born in Somalia is 80 times more likely to die before age five than a child born in Iceland.
Who Gets to Survive?
• Low-income countries face child mortality rates up to 15 times higher than high-income countries.
• The highest rates are in Sub-Saharan Africa and Central & Southern Asia.
• Children from low-income families are less likely to survive than those from wealthier backgrounds.
To close this gap, countries struggling with high child mortality should learn from success stories like Bangladesh and Ethiopia, which have significantly reduced their child mortality rates.
Comparison of Under-5 Mortality Reduction: Bangladesh, Ethiopia, and Rwanda have reduced child mortality at a much higher rate than Niger, Chad, and Somalia, despite facing similar economic challenges and having sharing same geographical locations
Lessons from Bangladesh and Ethiopia
Bangladesh has cut its child mortality rate by over 75% since 1990—one of the world’s best improvements.
Ethiopia has reduced child mortality by over 60% since 2000, thanks to major healthcare investments and community health programs.
How did they succeed?
• Investing in maternal and child healthcare
• Expanding vaccination coverage
• Improving nutrition programs
• Training community health workers
Under-5 Mortality and Mother’s Education
Education is key to child survival.
• Mothers with higher education levels are more likely to seek healthcare, provide proper nutrition, and recognize early illness signs.
• Countries with higher dropout rates (like Niger, Chad, and Somalia) have higher child mortality rates.
The Impact of Communicable Diseases
Countries with high child mortality also face high rates of communicable diseases and maternal nutrition deficiencies.
• Bangladesh and Ethiopia have strong vaccination programs, leading to major mortality reductions.
• Niger, Chad, and Somalia still struggle with widespread diseases, worsening child survival rates.
What Needs to Be Done?
1️-Strengthen education and prevent school dropouts, especially for girls.
2️-Implement strong vaccination programs, like those in Bangladesh and Ethiopia.
3️-Improve maternal and child nutrition to prevent early deaths.
4️-Combat communicable diseases through improved sanitation and healthcare access.
The Potential Impact
If other struggling countries follow the same path, they could reduce child mortality at similar rates:
• Ethiopia: Reduced mortality 5.5 times, from 200 deaths per 1,000 in 1990 to 46 in 2023.
• Bangladesh: Reduced mortality 5 times, from 146 in 1990 to 29 in 2023.
Applying these strategies in Niger, Chad, and Somalia could achieve similar progress.
Recommendations
• Expand healthcare access in low-income and rural areas.
• Improve maternal education and nutrition programs.
• Invest in clean water and sanitation.
• Scale up vaccination programs and community health services.
• Provide financial aid and international support to struggling nations.
If fully implemented, these interventions could save 9 million children under five by 2030.
Further steps could be taken to narrow the economical gap between high-income and low-income countries
1- Increase Global Investment in Health & Education
2- Enhance Technology Transfer & Innovation : Bridge the digital divide by providing access to technology, telemedicine, and AI-driven education
3- Develop Sustainable Job Creation Programs: Support entrepreneurship, vocational training
References:
1- World Bank World Development Indicators: “https://databank.worldbank.org/source/world-development-indicators”
2- UN Inter-agency Group for Child Mortality Estimation, 2024: “https://data.unicef.org/resources/un-inter-agency-group-for-child-mortality-estimation-unigme/”
3- Child Mortality, Still Birth and Causes of Death Estimates,April, 2024 : “https://childmortality.org”
As our planet grapples with the consequences of climate change, this blog post delves into the complex relationship between human activities and our environment. Specifically, we’ll explore the dynamics of carbon dioxide (CO2) emissions, shedding light on the countries responsible for the highest emissions and examining their consequences on both land and water ecosystems.
The Global Landscape: Top 5 CO2 Emitters
When fossil fuels such as coal, oil, and natural gas are burned for energy, they release large quantities of CO2 into the atmosphere. The excessive release of CO2 and other greenhouse gases enhances the heat-trapping effect, causing a gradual warming of the planet known as global warming. This warming, in turn, leads to a wide array of climate change impacts, including disruptions to ecosystems.
Our journey begins with a visual exploration of the top five countries contributing significantly to global CO2 emissions. China, the United States, India, Russia and Japan respectively account for the highest amounts of CO2 emissions.
The bar graph on the right displays the total amount of CO2 emissions released by those five countries in 2020, along with their percentage contribution to greenhouse gas emissions. Clearly, CO2 emissions constitute a significant share of overall greenhouse gas outputs, with notable contributions observed particularly in China and Japan.
Subsequently, the line graph traces the trajectory of CO2 emissions in those five countries, where the data reveals a significant upward trend in CO2 emissions in China. Meanwhile, the remaining countries exhibit a relatively consistent pattern in the evolution of their CO2 emissions.
Power Generation: Coal vs. Renewables
The two line graphs contrast the production of electricity from coal sources against the consumption of renewable energy. While electricity production from coal sources is following a constant trend, the nations are not doing much when it comes to renewable energy, where India is the country that uses the most renewable energy.
The Toll on Wildlife: Threatened Species
The first bar graph examines the status of threatened mammal and fish species in the top five CO2-emitting countries in 2018. The second bar graph unveils a different narrative; the bottom five countries contribute less to global emissions. While this correlation warrants further exploration, it prompts us to consider whether lower emissions may indeed be associated with a lower number of threatened species.
In response, the following recommendations are proposed to guide collaborative efforts towards a sustainable and resilient future:
Global Collaboration: Nations, particularly the top emitters, must commit to CO2 emissions reduction and participate in international initiatives to address climate change.
Renewable Energy Acceleration: All countries, especially those heavily reliant on coal, should prioritize and accelerate efforts to increase the share of renewable energy in their energy portfolios. Investment in research, development, and implementation of sustainable energy technologies is paramount.
Conservation Initiatives: Nations with high emissions must implement robust conservation programs to mitigate the impacts on threatened species. Conversely, lower emitters should continue efforts to maintain a positive outlook for their wildlife.
Aforestation and Reforestation: Invest in afforestation (planting trees in areas that were not forested) and reforestation (replanting trees in deforested areas) projects to absorb CO2 from the atmosphere.
Carbon Capture and Storage (CCS): Develop and implement technologies that capture and store CO2 emissions from industrial processes and power plants, preventing them from entering the atmosphere.
Public Awareness and Education: Increase public awareness about the impact of individual and collective behaviors on CO2 emissions. Education campaigns can encourage more sustainable choices in daily life.
By combining these recommendations and tailoring them to specific regional contexts,the governments, industries, and individuals can contribute to a significant reduction in CO2 emissions, fostering a more sustainable and resilient planet.