Access to education is often considered a fundamental right, yet many communities face unequal opportunities that depend heavily on geography. To understand these differences, I examined the percentage of towns in each Lebanese region that have at least one educational resource, such as a school or learning center. The results reveal a clear and important story about inequality.
The visualization below orders regions from lowest to highest in terms of educational access. Immediately, we see a significant gap: some regions provide educational access to only 13% of their towns, while the best-performing regions reach as high as 82%. This means that the likelihood of a child having a school nearby can vary by more than sixfold depending solely on where they live.
The lowest-access regions appear on the left side of the chart, highlighted in orange. These areas fall far below the national average of 48%, indicating long-standing infrastructure challenges. Such limited access has real consequences: longer travel distances, lower enrollment, and higher dropout rates. For many families, the barrier isn’t financial—it’s geographical.
In contrast, the regions on the far right, highlighted in blue, demonstrate what more consistent investment and infrastructure can achieve. With access levels surpassing 70–80%, these areas offer a more stable environment where education is physically within reach. The contrast between the two ends of the chart is not simply a statistical difference—it represents a profound inequality in opportunity.
The national average line, shown in the middle of the chart, reinforces this divide. Nearly half the regions fall below that benchmark, illustrating that educational access is not evenly distributed across the country.
Ultimately, this visualization highlights a key insight: educational opportunity in Lebanon is shaped not just by policy or funding, but also by geography. Identifying these regional disparities is the first step toward closing the gap and ensuring that all students—regardless of where they live—have a fair chance at accessing education.
It was a quiet Sunday afternoon in a small town in the West Bekaa. Two friends, Jad (15) and Rami (14), were enjoying a simple innocent motor bike ride. But unfortunately, they were hit by a speeding SUV.
The town folk gathered around the 2 boys that were laying bleeding on the asphalt road. The ambulance arrived quickly. Jad needed immediate, high-level trauma care. He needed a specialized surgeon within minutes. The nearest facility capable of saving his life, however, was in Zahle, a 45-minute drive through challenging rural roads.
For severe trauma, 45 minutes is not a journey, but it is a critical time window that determines fate. While Rami survived after weeks in the ICU, Jad unfortunately bled out on the way.
His death wasn’t solely a result of the collision. But it was a devastating consequence of a systemic, geographical failure.
The Evidence: Mapping the Disparity
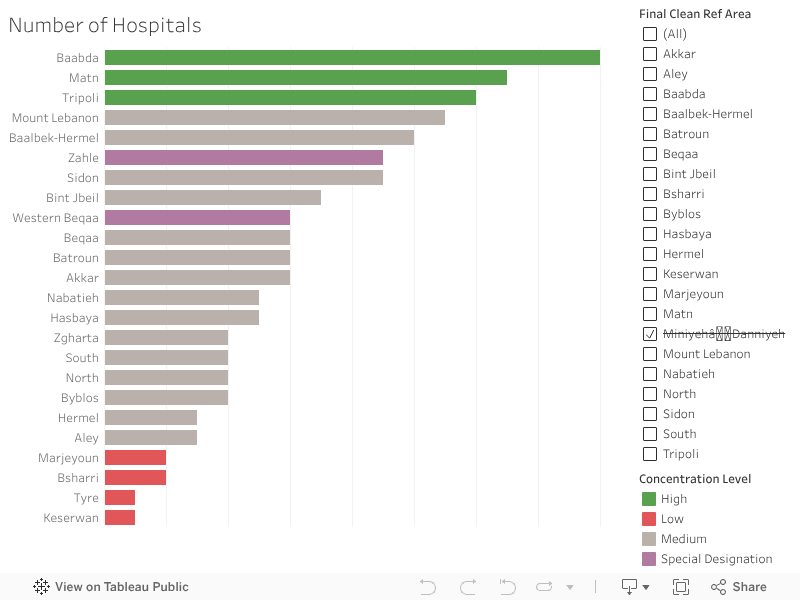
This tragedy is not an isolated incident of bad luck. It is the human cost of a deeply imbalanced healthcare system. Our data analysis confirms what rural families already know: Access to care is dangerously centralized.
The visualization of medical facilities across Lebanon’s districts illustrates this shocking disparity:
The areas highlighted in Green (the top 3) enjoy a dense concentration of hospitals, offering multiple lifelines within minutes.
On the opposite end, the areas highlighted in Red (the bottom 4) show bars that are barely visible, confirming these are healthcare deserts.
The system is designed to serve the city, leaving the vast rural expanse with an inadequate margin of error. Your chance of survival is, quite literally, dictated by the proximity of your nearest bar on this chart.
The Solution
We cannot solve the problem of distance by trying to build a new university medical center in every district. That is fiscally impossible. The real solution is smart, targeted investment in stabilizing the patient, not relocating the hospital.
Our data, which shows the alarmingly low density of First Aid and Care Units in the rural areas, points directly to the answer. We must transform these simple clinics into advanced, highly efficient units.
1. Buying Time
The difference between life and death for someone like Jad is the critical time immediately following a severe injury.
The goal of a new, Trauma-Ready Care Unit is to manage and stabilize major injuries (like severe bleeding or airway obstruction) for 30 minutes. It’s not a full operating room, but it has the specialized staff and equipment to:
Stop the Clock: Stabilize the patient with basic surgical procedures.
Coordinate Transport: Link immediately with air or specialized ground ambulance services.
By creating these small hubs, we effectively shrink the deadly 45-minute travel time into a manageable window, giving the patient the chance to survive the journey to the major hospital.
2. Decompressing the ER
The benefits flow both ways. Today, emergency rooms in major urban hospitals (like those in Zahle or Baabda) are often jammed with non-critical cases:
Minor broken bones
Deep lacerations needing stitches
Dog bites and severe infections
By upgrading rural units, these facilities can handle this high volume of urgent but non-life-threatening cases.
The immediate effect is a massive reduction in pressure on the urban ERs. This allows the major city hospitals to focus their specialized surgeons and resources entirely on the true, severe emergencies, like the trauma case that should have saved Jad.
Big Idea: “Healthcare equality is not just about bringing care closer; it’s about making sure the right care is available at the right time for everyone, everywhere.” Investing in these small, advanced units is the fastest, most cost-effective way to bridge the deadly gap on our map.
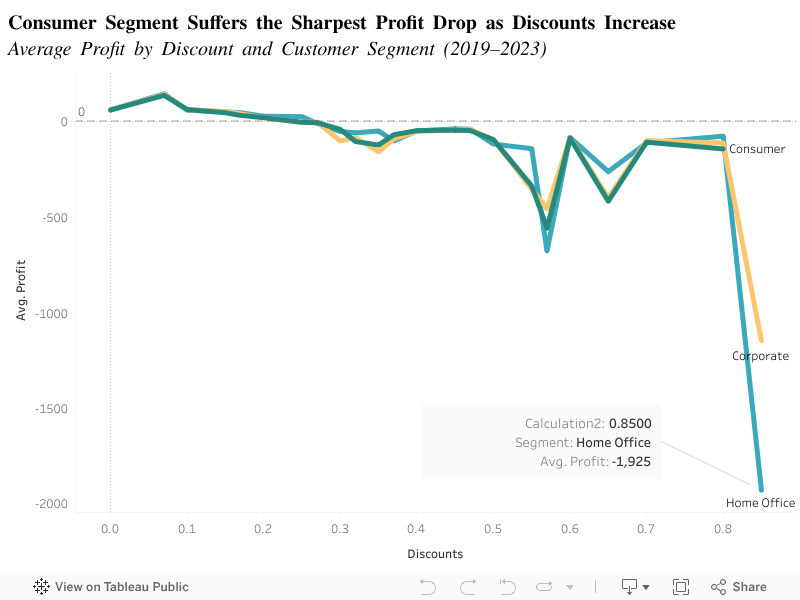
Most businesses offer discounts to boost sales and expect profits to follow. And discounting does increase purchase likelihood for some customers. But our analysis of sales data from 2019–2023 shows a surprising pattern: as discounts grow, average profit can collapse; especially for the Home office segment. Therefore, discount strategy needs to be segment-specific and evidence-based to avoid large financial losses.
Data: Sales transactions and profit per order, 2019–2023 (segmented: Consumer, Corporate, Home Office).
Question:How does average profit change as discount levels increase for each customer segment?
X axis: Discount level (0–85%).
Y axis: Average profit per order.
Each line = a customer segment (Consumer, Corporate, Home Office).
At low discounts the segments have stable profits. But past ~50% discount, profits decline. The Consumer line falls the fastest and deepest; at ~85% discount the Consumer segment reaches nearly –$2,000 average profit.
Insight: Deep discounts have a non-linear, highly negative impact on average profit for the Home office segment. Corporate and Consumer also decline but less steeply.
Home office often buy lower volumes and purchase lower-margin items; extreme discounts remove the margin buffer and flip the transaction into a loss. Corporate buyers may purchase higher volume or negotiate different terms that preserve margins.
Implications:
Avoid blanket deep discounts. Limit very large discounts for home office retail segments.
Segmented discount rules. Use smaller, controlled discounts for home office; allow negotiated or volume discounts for Corporate accounts where margins hold.
Test discount thresholds. Implement A/B tests and monitor profit by segment (use alerts when average profit crosses a risk threshold).
Revise loyalty incentives. Consider non-price incentives (bundles, loyalty points) for consumers rather than steep discounts. Discounts drive behavior, but beyond certain thresholds they destroy profit. A segment-aware pricing policy protects margins and keeps promotions profitable.
In Heart Attacks, Every Minute Lost Reduces Survival
Heart attacks don’t negotiate. Once symptoms start, the countdown begins and survival depends on how fast a patient reaches a hospital that can intervene. This makes geography a health factor.
In Lebanon, where hospitals are not evenly distributed across districts, access time can vary sharply from one place to another. The question isn’t only “how many heart cases do we have?” but also “how close is care when those cases happen?”
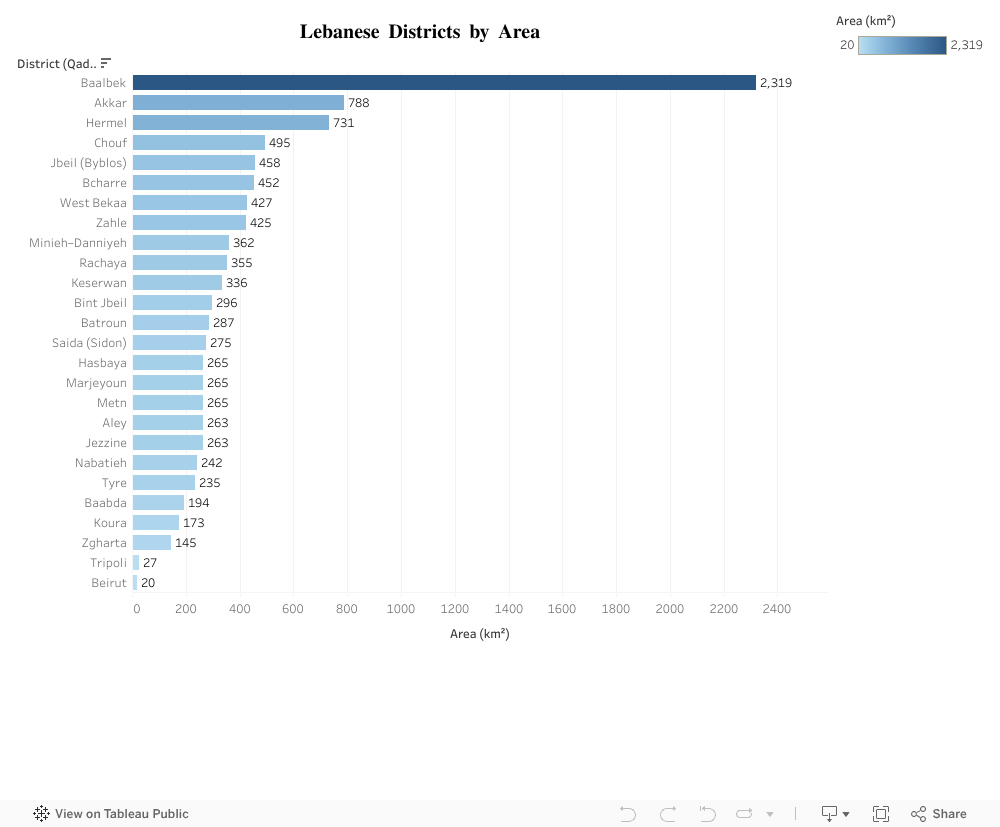
Akkar vs. Baabda: A District Size Contrast That Matters
Akkar and Baabda illustrate Lebanon’s geographic contrasts clearly. Akkar spans 788 km², making it one of the largest districts in the country, with wide and spread out communities. Baabda, by comparison, covers just 194 km² nearly four times smaller.
This difference isn’t just a cartographic detail; it fundamentally shapes residents’ access to services. In a district as large as Akkar, simply reaching a hospital can take significantly more time, while Baabda’s compact size naturally supports quicker, more concentrated access to care.
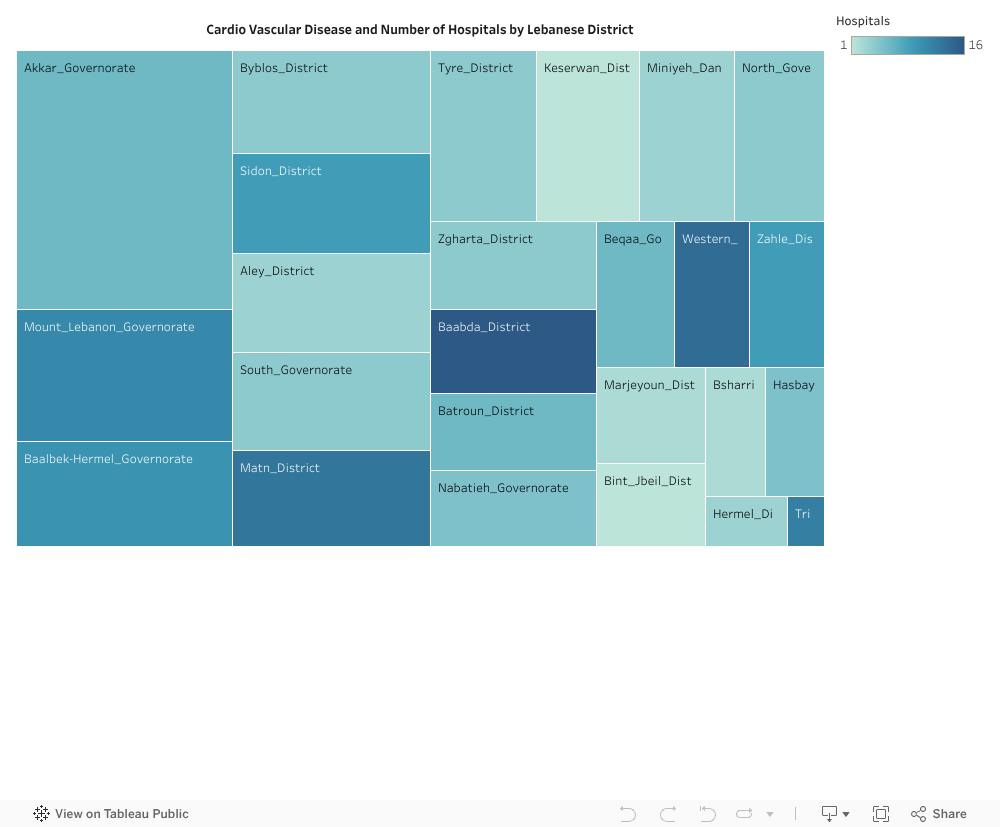
Mismatch between burden and capacity
Akkar also shows a high cardiovascular case load
In other words:
Big territory → longer distances by default
Low hospital density → fewer nearby entry points for emergency care
High cardiovascular cases → more people needing urgent access
That combination is a red flag. It implies that when heart attacks strike in Akkar, residents are more likely to face delayed arrival to care compared to smaller, better served districts.
What could realistically improve this?
This isn’t about building a hospital in every village. It’s about optimizing emergency reach. Lebanon already has health infrastructure, the strategic gap is spatial coverage and speed.
A practical way forward is to reduce time to care in high burden, low coverage districts through targeted interventions such as:
Upgrading/expanding emergency-capable units in under-served districts
Deploying advanced ambulance hubs positioned for maximum coverage
Formalizing rapid transfer pathways to the nearest cardiac-capable hospital
The goal is simple: even if a hospital isn’t next door, the system should behave like it is by cutting delays.
How to prioritize smartly?
The visuals naturally suggest a prioritization logic:
Identify districts with high cardiovascular cases (large bars / darker heat).
Among them, flag those with low hospital density (lighter color).
Cross-check physical area (larger districts imply longer response routes).
Districts like Akkar fall into the high-priority quadrant: large area, high burden, low coverage. These are the districts where a marginal improvement in access time could prevent disproportionately more deaths. That’s high ROI health policy.
Align capacity with need
If we reduce time in districts like Akkar, through more emergency nodes, better equipped local units, or faster transfer networks, we align capacity with need without requiring unrealistic nationwide hospital expansion.
Next Steps?
Lebanon should treat emergency cardiac access as a geographic equity issue. Health planning must go beyond counting hospitals, it should measure how fast people can reach lifesaving care, especially in high burden districts.
Because in a heart attack, there’s no such thing as an average patient. There’s only the patient who needs help now, and whether help is close enough to arrive in time.
Lebanon is often described as a water-rich country. With hundreds of natural springs feeding rivers, valleys, mountain basins, and dams, it is natural to expect reliable access to clean water. Yet for many households, purchasing water from private suppliers remains a normal part of daily life, even in regions surrounded by natural water sources.
This mismatch raised a simple but important question: If Lebanon has so many natural springs, why do so many towns still rely on purchased water?
What the Data Shows
The visualization compares two key measures across Lebanon’s governorates:
The number of natural springs (total, permanent, or seasonal)
The percentage of towns in each governorate that rely on purchased water
You can interact with the chart using filters to:
Explore specific governorates
Switch between total, permanent, or seasonal springs
Show or hide the purchased-water trend line
A Surprising Pattern
At first sight, we might expect places with many springs to rely less on purchased water. But the data reveals a different story.
Akkar and Mount Lebanon appear consistently water-rich across all spring types (total, permanent, and seasonal) yet roughly a quarter of their towns still rely on purchased water. This shows that even governorates with abundant natural sources do not always provide reliable public access.
Beqaa, despite having far fewer springs than Akkar and Mount Lebanon, records the highest reliance on purchased water, with more than a third of its towns depending on private suppliers. This makes Beqaa a clear example of how limited natural springs and weak distribution amplify each other.
Baalbek-Hermel, South Lebanon, and Nabatieh have moderate to low numbers of springs, yet many of their towns continue to use purchased water as well. Even where seasonal or permanent springs exist, public networks often cannot capture or distribute them effectively.
Interestingly, the North, which has the lowest number of springs in every category, relies less on purchased water than water-abundant governorates like Akkar and Mount Lebanon. This contrast reinforces the idea that the challenge is not simply about how much natural water a region has, but how well that water is managed, delivered, and made accessible to households.
The pattern is clear: Water availability and water access are not aligned.
In other words, Lebanon doesn’t have a water availability problem. It has a water accessibility problem.
Why This Gap Exists
The visualization points to a structural mismatch: the regions with the most springs are not always the regions with the best water service. Broader assessments of Lebanon’s water sector help explain why:
Many springs are located far from population centers
Distribution networks are fragmented or old
Seasonal springs are not always integrated into supply systems
Even permanent springs may not be connected to public pipelines
This means that households may live only a few kilometers from a natural spring yet still lack regular public water service, pushing them toward purchased water, especially in summer or during shortages.
Why This Matters
Understanding this mismatch reshapes the way we think about Lebanon’s water challenges:
The problem is not simply “water scarcity”
The problem is also about distribution, planning, and infrastructure
Investing in better transport systems, modernizing networks, and capturing more of the existing springs could significantly reduce households’ dependence on purchased water.
Conclusion
Lebanon is not a water-poor country! It is a country where natural abundance doesn’t translate into reliable access.
By exploring where springs are located versus where purchased water is still heavily relied upon, this visualization highlights a critical opportunity:
Lebanon doesn’t need more natural water. It needs better ways to deliver the water it already has.
Understanding this mismatch is only the first step. Lebanon needs a water system that can collect, distribute, and deliver its natural resources to the communities that depend on them. Improving planning, strengthening networks, and making better use of existing springs can significantly reduce the country’s reliance on purchased water.
So the real question going forward is this: how can Lebanon turn the water it already has into water people can actually count on?