Beyond the Waiting Room: Revealing “Invisible” Patients of an NGO
By: Nivine Manasfi, Wissam El Sabeh, Yasmina El Dirani, Hussein Charafeddine, and Perla Abou Rjeily
In humanitarian aid, success is often measured by volume. For the Imam Sadr Foundation (ISF), 31,430 patient visits over two years suggested a thriving system. However, our deep-dive analysis revealed that aggregate numbers were hiding a “silent crisis” of missing patients.
To understand why these groups were missing, we didn’t just look at the records—we asked the community. Here is how our impact survey validated the data and shaped our solutions.
1. The Gender Gap: It’s About Work, Not Health
Data showed a stark imbalance: 67% of patients were female, while only 33% were male. Our survey revealed the structural cause:
70% of patients admitted to missing medical visits specifically due to work or school commitments.
80% confirmed that extending clinic opening hours would directly facilitate their access to care.
The Fix: We proposed launching “Evening Clinics” (5 PM – 8 PM) to capture the working demographic that the current schedule excludes.
2. The Mental Health Stigma
Despite high trauma levels in the region, Syrian refugees accounted for near-zero mental health visits. The survey confirmed that stigma is the primary barrier:
62% of patients cited “privacy and secrecy” as the main reason they avoid seeking mental health support.
Integrating mental health screenings into general medical visits was the 3rd highest requested service improvement.
The Fix: By integrating mental health checks into standard intake forms, clinics can bypass the “psychotherapy” label that scares patients away.
3. Neglecting Prevention
Preventive services (like vaccination and dental) made up less than 1% of total visits. However, the survey proved this isn’t due to a lack of interest:
~85% of patients confirmed a moderate to high need for proactive health services.
The Fix: The demand exists. We recommended strengthening the preventive infrastructure and using doctors, rather than just nurses, to drive awareness during standard consults.
Conclusion
Analyzing the dataset turned “records” into insights, but the survey turned that insights into action. By shifting our focus from volume of visits to equity, we proved that true healthcare success isn’t just about how many people you serve—it’s about ensuring no one is left invisible.
How Data Visualization Revealed the Real Issues Behind the Instability in the Performance of ChocoStory
Launched in 2018 in Verdun (Beirut), ChocoStory quickly gained popularity: a prime location, strong foot traffic, and the owners’ network. The store combines walk-in chocolate items products with experiences like chocolate workshops and a museum.
However, when we first examined ChocoStory’s performance, one thing was immediately clear: growth wasn’t steady. Sales would surge, only to drop sharply right after, and this pattern kept repeating every year.
That raised a key question. Why did the business grow in some periods but lose momentum just as quickly? This pointed to structural issues rather than simple seasonality.
Our approach is simple but powerful: use data to understand how market dynamics, customer preferences, and internal costs shape ChocoStory’s inconsistent performance. We used a series of visuals that helped us walk through the timeline and understand what was affecting the numbers.
Understanding the Swings in Performance
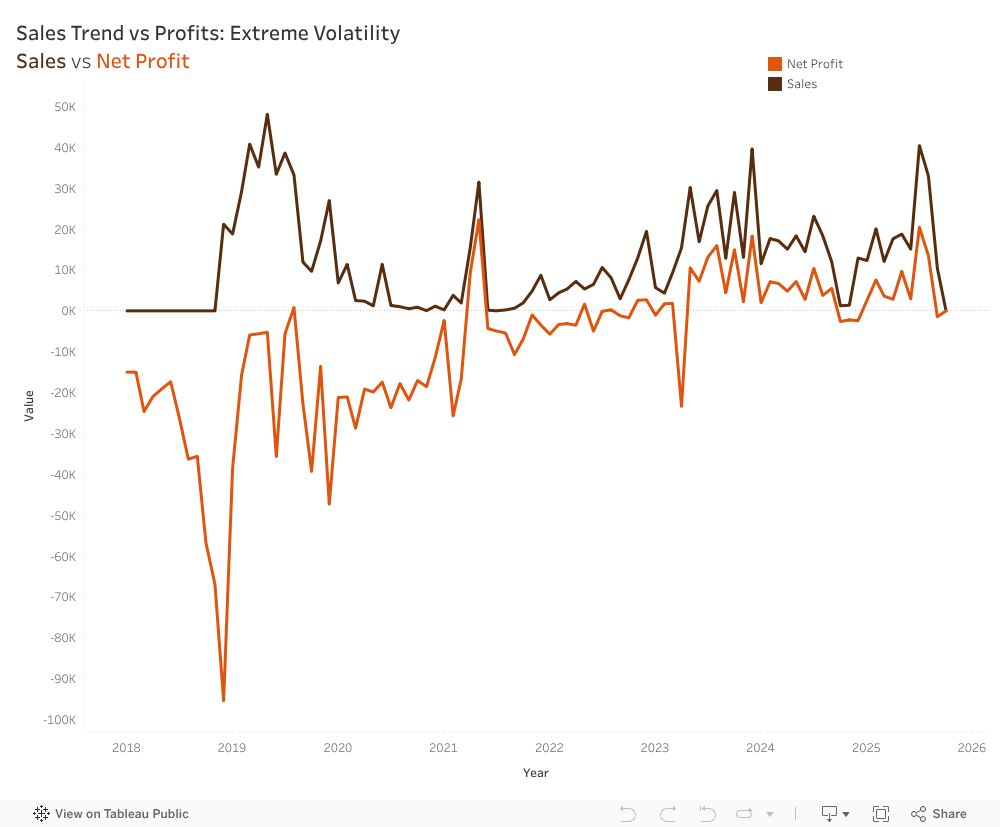
The first step was mapping both sales and net profit from their opening in 2018 until the present.
This revealed a cycle of volatility that repeats year after year, showing how heavily the business relied on peak seasons. Net profits follow the exact same pattern as Sales, almost like a shadow, just consistently lower. Profitability relied entirely on sales peaks rather than efficient operations, meaning any drop in demand immediately pushed the company into a loss.
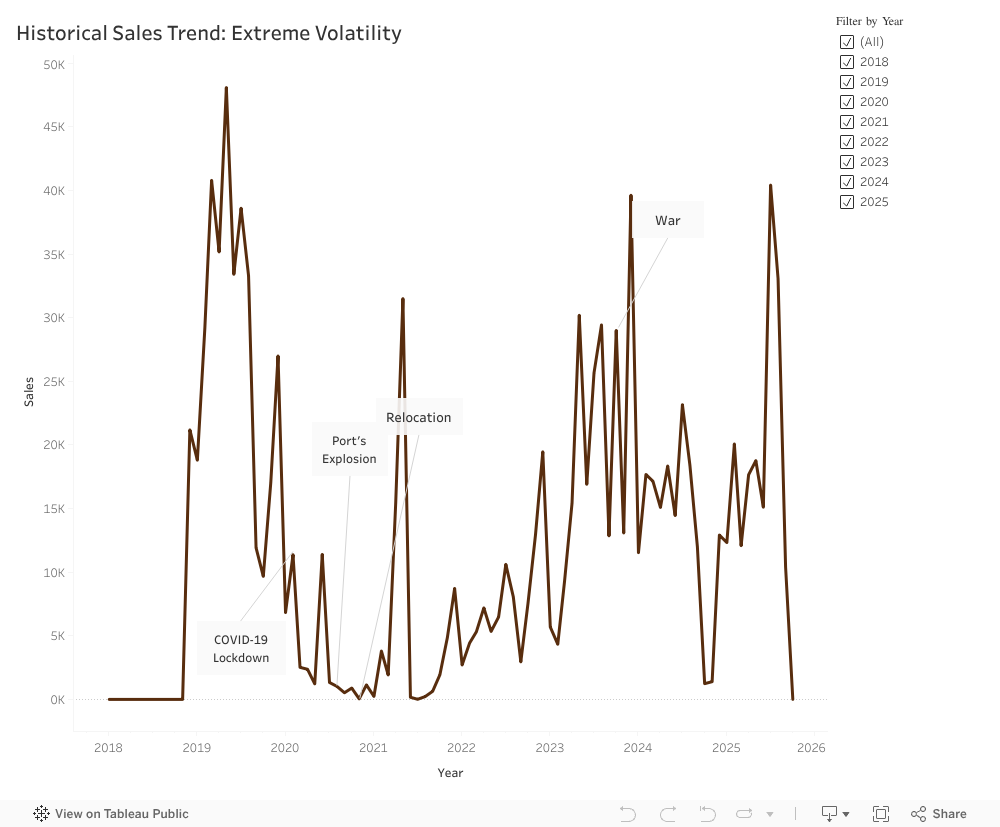
How External Events Influenced the Numbers
Looking across the years, it became clear that ChocoStory’s performance was closely tied to what was happening around it.
The early period was steady, but the situation changed fast.
Covid-19: Foot traffic reliance backfires; digital gap hurts.
Port Explosion: Supply chain chaos; no quick adaptation.
Disruptions will happen, but their impact depends on how equipped the business is to handle them. Too often, ChocoStory reacted slowly or only partially.
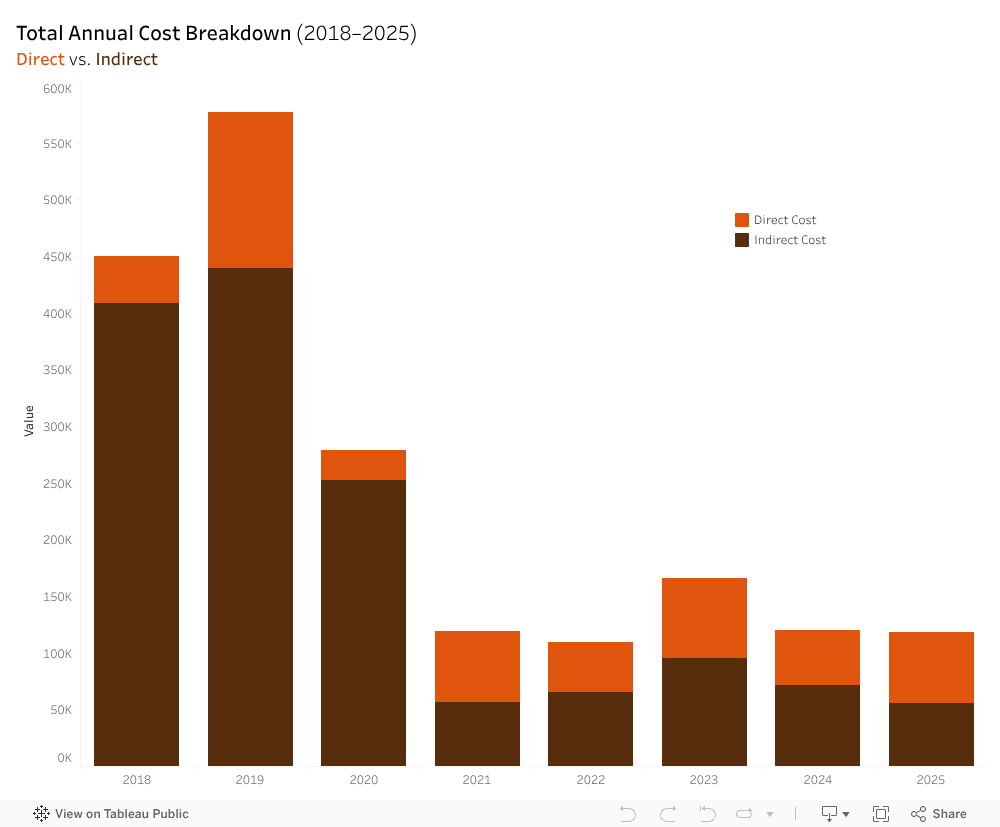
What the Cost Structure Revealed
At first glance, ChocoStory’s expenses looked normal, but when they were broken down into the direct and indirect costs stacked barchart, a different reality emerged. Before 2021, direct costs (workshop materials, chocolate ingredients, packaging, etc.) were relatively stable. Indirect costs, however (rent, utilities, electricity, etc.), fluctuated heavily, with not enough revenues to break even.
The total expenses vs net profit line chart showcased two lines behaving in a symmetrical pattern. When expenses rose, profits dropped. Likewise, when expenses fell, profits increased. This approximate symmetry highlighted a deeper issue: ChocoStory had almost no safety margin. With indirect costs absorbing such a large share of total expenses, the business was operating with a net profit loss. It was only after the 2021 relocation that the gap between the lines narrowed down, and ChocoStory began breaking even. However, they were unable to sustain an upward profit trend beyond break even.
4. Rethinking the Product Portfolio
ChocoStory offers a wide range of chocolate items. There are 206 products, compared to just 28 service offerings.
At first glance, this creates the impression of a product-led business, assuming they generate enough profits compared to operational weight. Yet, comparing the revenue generated by each proves otherwise:
Based on that chart, it becomes clear that products generated around LBP 4.5B only, while services reach LBP 11B. The highest revenue contributors were the services (workshops and museum) indicating that ChocoStory operates more as an experience-driven destination and less like a traditional chocolate shop.
Visibility and Online Presence
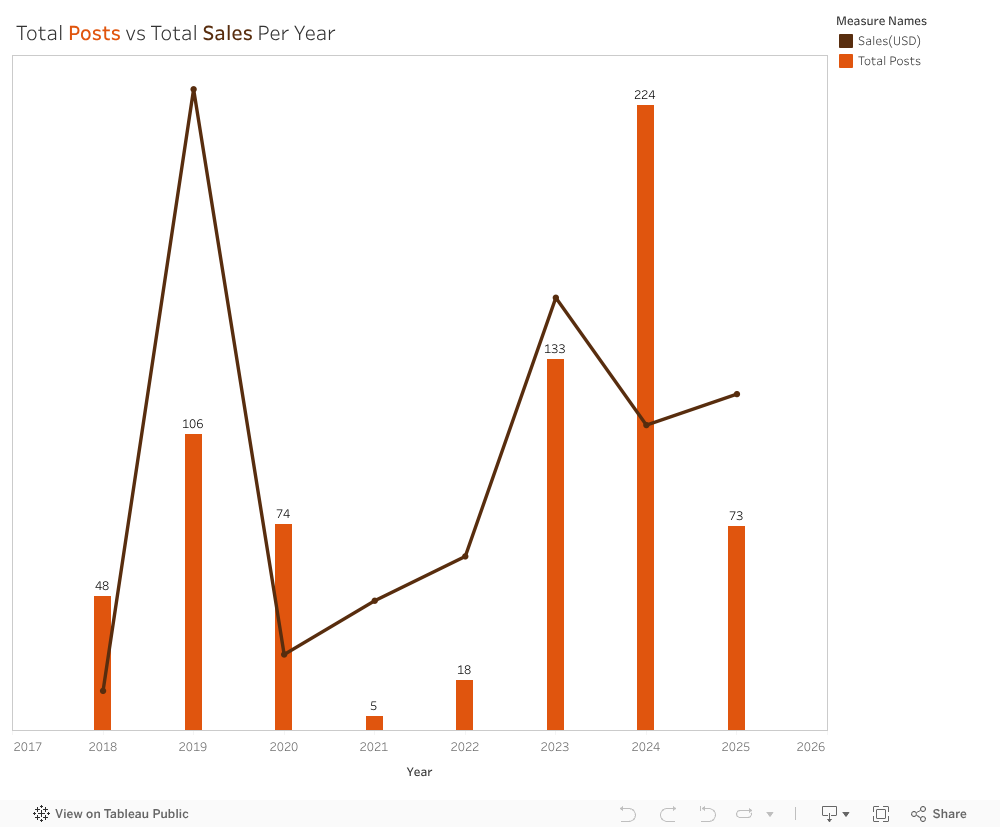
We reviewed the platforms because visibility on social media affects how easily customers find and engage with the business. We looked at posting activity across Instagram, Facebook, and Threads from 2018 to 2025 and compared yearly posts with yearly sales. Activity varied widely. In 2021, only five posts were published during the relocation period, which aligned with the lowest sales in the dataset. Posting increased again in 2023 and peaked in 2024, but sales did not return to 2019 levels, when posting was more moderate. We also noted that ChocoStory was not active on TikTok, despite it being a major discovery platform for local experiences.
Our wider analysis showed a clear gap in engagement by content type. A workshop-and-museum video reached more than 784,000 views, while a seasonal product post received 37 likes. This showed that experience-focused content resonated far more than product photos. Taken together, the results suggest that visibility shifted across the years, and that content type mattered more than posting frequency.
A Clearer Path Forward
ChocoStory’s main challenge isn’t the chocolate, it’s not understanding its customers. Our team recommended concentrating on the audiences that naturally fit the workshop experience, especially children between 4 and 14. Schools and camps can create a steady flow of visits throughout the year. Simplifying the product list can reduce operational strain and help redirect attention to the experiences that matter most.
During our visit, the ChocoStory team confirmed that these insights aligned with their own observations. They plan to reduce the number of products, strengthen communication around the workshops, and develop a more structured marketing plan.
This analysis showed how much can be learned from placing data into clear visuals. Trends that look confusing in raw numbers become understandable once they are visualized. ChocoStory faced several disruptions from outside events, but many challenges also came from how the business was structured. With a clearer view of what drives performance, the company can now build on its strengths and create more stable growth.
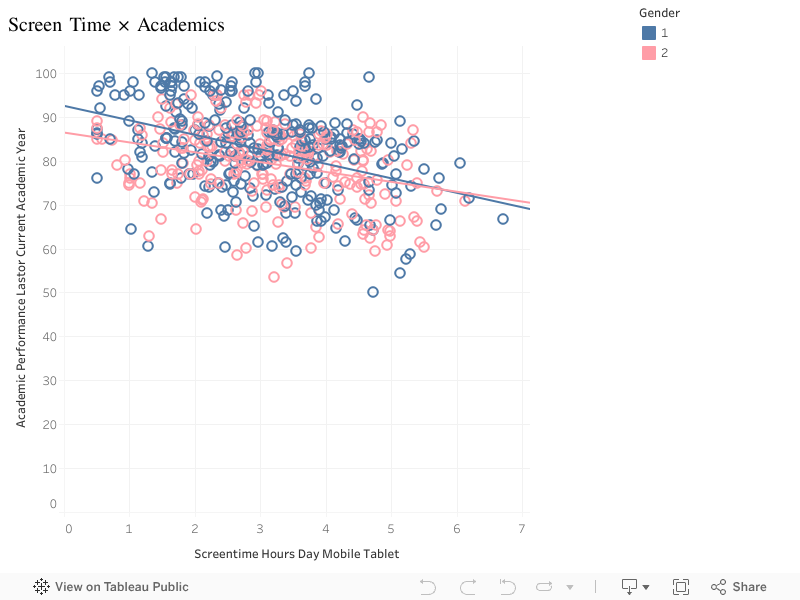
What if the hours children spend scrolling every day are quietly shaping how anxious they feel — and even how well they perform in school?
Using a cross-sectional dataset of Lebanese students aged 8–14, this analysis explores the relationship between daily screen time, anxiety, gender, outdoor play, and academic performance.
1. How Much Screen Time Do Children Get?
Most students spend 2–4 hours/day on mobile or tablet devices, but a noticeable group reaches 5–7 hours. This suggests a segment exposed to high digital consumption.
2. Anxiety Levels Are Widely Spread
Anxiety scores range from 10 to 100, with most students clustering around 40–55. A significant minority shows severe anxiety.
3. More Screen Time = More Anxiety
A clear positive correlation emerges:
As screen time increases, anxiety rises across both boys and girls.
This relationship remains strong even when controlling for age.
4. Gender Differences Are Small but Present: Girls show slightly higher anxiety and slightly higher screen time. But the trend lines for both genders are almost identical — meaning screen time, not gender, is the main driver.
5. Anxiety Reduces Academic Performance: Students with higher anxiety tend to have lower academic scores, with a noticeable decline past anxiety scores of 60.
6. Screen Time Reduces Academic Performance (Slightly): More screen time is associated with lower grades, although the effect is weaker compared to anxiety.
7. Outdoor Play Offers a Small Protective Effect: More outdoor playing hours slightly reduce anxiety, suggesting a helpful intervention.
Conclusion
Across the dataset, a consistent pattern emerges:
More screen time → higher anxiety → weaker academic performance.
Encouraging even small reductions in daily screen use — or adding more outdoor time — can help protect children’s mental well-being.
Lebanon’s hospitality industry has endured some of the toughest years in its history. COVID emptied hotels and restaurants almost overnight. The economic collapse made it difficult for businesses to operate amid power cuts, fuel shortages, and soaring costs. More recently, regional tensions have slowed travel and pushed many southern and rural destinations into survival mode.
Yet the latest tourism data shows something important. The treemap reveals that most hotels remain concentrated in districts like Matn, Keserwan, and Byblos. At the same time, the tourism index shows that some of the most appealing destinations for visitors are elsewhere. Tripoli, Western Beqaa, Hasbaya, and Nabatieh all rank high in tourism experience despite having far fewer hotels.
This gap between where tourists want to go and where hospitality infrastructure actually exists is one of Lebanon’s biggest lost opportunities. It reflects years of underinvestment made worse by crisis after crisis.
But it also points to a clear path forward. Investing in roads, stable electricity, clean water, internet connectivity, and the preservation of cultural and natural sites would immediately boost the capacity of high-potential regions. Strengthening infrastructure beyond Beirut and Mount Lebanon would unlock new jobs, revive local economies, and distribute tourism revenue more evenly across the country.
Lebanon does not need to rebuild its appeal. It needs to rebuild the foundation that allows hospitality to grow. With the right infrastructure, the regions that tourists already love can finally receive the investment they deserve.
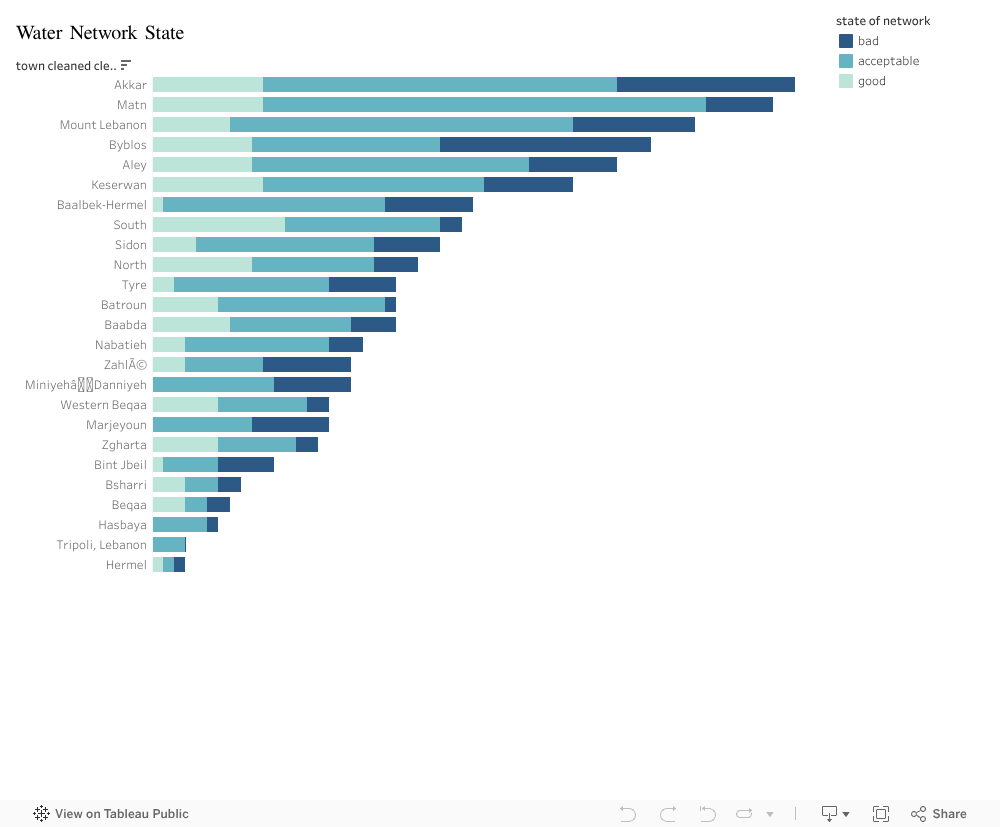
Access to clean and reliable water is essential for every community. Yet across Lebanon, towns experience water services very differently. To understand these variations, I visualized observational data showing the condition of local water networks, categorized as good, acceptable, or bad.
Infrastructure That Doesn’t Serve Everyone Equally
The visualization quickly reveals an uneven landscape. Some towns—such as Akkar, Matn, and Mount Lebanon—show mostly good or acceptable network conditions, indicating infrastructure that still holds up. But as we move further down the chart, the balance shifts. Towns including Baalbek-Hermel, Sidon, and South show growing portions of failing networks. In places like Tripoli and Hermel, “bad” network conditions dominate completely. This contrast highlights a deeper issue: while some communities receive stable water services, others face continuous breakdowns and unreliable access.
The Water Crisis Is Uneven, Not Uniform
The data shows that Lebanon’s water challenge isn’t one big national problem—it’s a set of local inequalities. Towns differ dramatically in how well their networks function. For thousands of people, poor network conditions mean real daily consequences: limited supply, contamination risks, and increased dependency on costly alternatives like water trucks. By viewing these towns side by side, the visualization exposes where gaps are the largest and where support and maintenance are most urgently needed.
Understanding the Gaps Helps Fix Them
Seeing these differences clearly is the first step toward improving water access across Lebanon. Strengthening the towns with the weakest infrastructure can reduce health risks, promote fairness, and create more resilient communities. The story the data tells is simple: improving water networks should start where conditions are the worst—because not every town is receiving the same basic quality of service.
I will never forget his name.
Omar. He was about my age, walking around the street and asking for directions. He stopped me but I didn’t know the place, so I suggested trying it on Google Maps to see if he can find it. Omar looked at me, embarrassed, and told be he couldn’t do that. Why? Not because he didn’t have a phone, he did. Not because it didn’t have power, or connection, it did. But because he didn’t know how to read and write. I consider myself to be one of the lucky ones.
I grew up in a world where education is a given, not a luxury, where graduating is a rite of passage not a privilege, where going to university is the norm, not the exception. I am one of the lucky ones because I never had to question all of this as a child. I never had to think about my life as being anything else than going to school. People like you and me, we forget that some people don’t know how to read, some barely know how to count, some stopped going to school at 12 years old. We take it all for granted. But when reality hits you like that, everything shatters. Today, I remind you of them, of the Omars of the world. We need to act now, today.
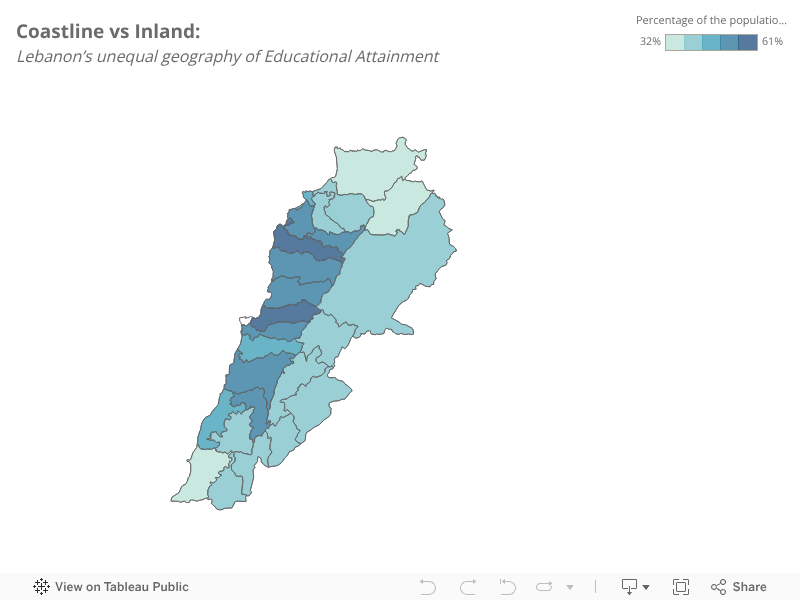
In Lebanon, where you live still decides what education you get…
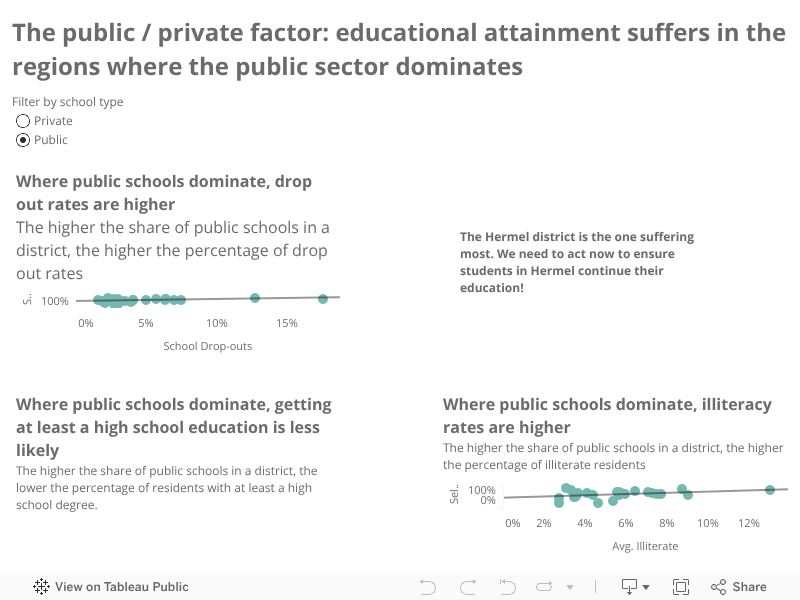
But how can all of this be explained? What influences such disparity? What are the factors at play? These questions needed to be answered to find out the next course of action. The common denominator? The gap between the private and the public sector. It’s where inequality starts brewing.
In the districts where the share of public schools is higher, the percentage of residents with at least a high school degree suffer and both drop-out rates and illiteracy rates grow. As such, the higher the percentage of private schools in the district you live in, the more likely you’ll make it to university. But, private education is expensive and not accessible to everyone, and getting public schools to catch up to the level of private ones takes a lot of time and requires a very big investment. In the meantime, thousands of students are abandoning their studies… We need to bridge the gap, and fast.
Educating about Education in the public sector.
The first step is awareness. We need to educate public students on the importance of continuing their education. If they don’t know why they should go on with their studies, then anything else we try, will fail. Through my NGO, I developed a program that we would like to test-run.
Our program is three-fold:
Highlights the importance of continuing an education and the long term benefits it provides.
Addresses the reasons why public school students typically abandon their studies, suggests solutions and frames education within those issues.
The program will be repeated and updated as students get from elementary to intermediate to secondary to assess new concerns tied to the evolving context in Lebanon, age-related concerns.
To do that, we need the ministry of education’s approval to begin activation within public schools. Ideally, we would like to start with Hermel, which is the biggest problem area, as it is the worst across in all 3 key measures. This ensures at the same time, that we maximize the number of students we’ll be able to help.
Equal access to education should not a child’s naive idea of reality, it should be the norm. I ask you to say yes, not for me, but for all for all the kids out there who won’t get a proper education because they were born in the wrong place. For those who have enormous potential, but will never get to reach it. For those who should have gone on to do great things. For Omar. For all the kids who were born a few kilometers inland.