Unveiling Exam Success: Insights into Student Performance
Education shapes futures, but what factors play the most significant role in student success? This project explores student performance through data from a Kaggle dataset and a survey conducted among students from AUB and other universities. The goal is to uncover patterns and factors that influence academic achievement to inform educational strategies and mental health support.
The analysis highlights the prevalent academic and emotional challenges faced by students, such as high stress, poor mental well-being, inconsistent study habits, and inadequate resources. These factors collectively contribute to low academic performance and emotional instability. Using data-driven insights, the evidence demonstrates that high stress negatively impacts GPA, as shown in stress and exam score correlations. Furthermore, inconsistent study habits, particularly studying for 1-2 hours daily, lead to heightened variability in mental well-being, reflecting emotional instability. Parental influence also emerges as a critical factor, with students from higher-educated families performing better academically. These findings underline the need to address interconnected academic, psychological, and environmental barriers to improve student outcomes comprehensively.
Crash injuries are ranked as the eighth leading cause of global mortality across all age groups and this is predicted to climb to seventh by 2030. Lebanon, in particular, stands out with a safety record deemed “among the worst globally” by the World Bank. According to 2020 data from the World Health Organization (WHO), Lebanon holds the 89th position in global safety rankings.
Due to the importance of the above-stated issue, we analyze the primary causes of road crashes, focusing on fatalities and the most affected population, wrapping up with recommendations for authorities.
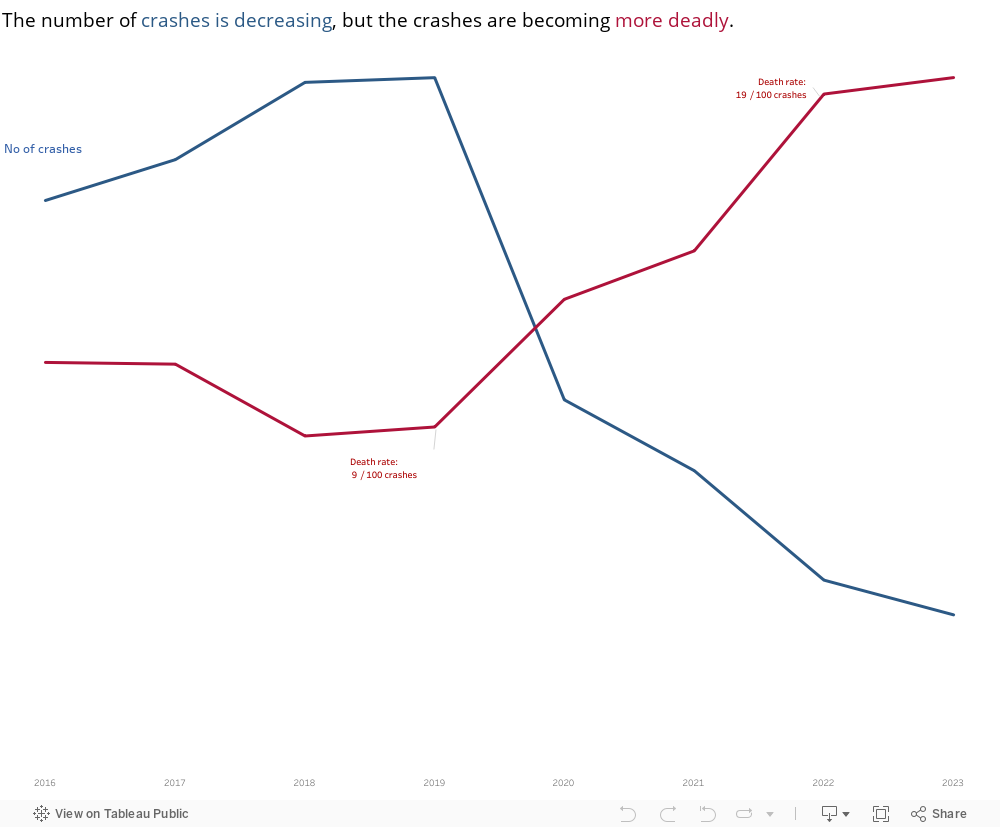
To start with, the number of crashes in Lebanon followed an upward trend until it reached its peak in 2019. After the economic crisis in Lebanon and the increase in gasoline prices in the country, the number of crashes decreased and started following a downward trend till today. Although these numbers seem promising, when examining the death rate / 100 crashes, we notice that it has been following an upward trend since 2019. This suggests that while the overall number of accidents in Lebanon has decreased compared to four years ago, the severity of these accidents has escalated.
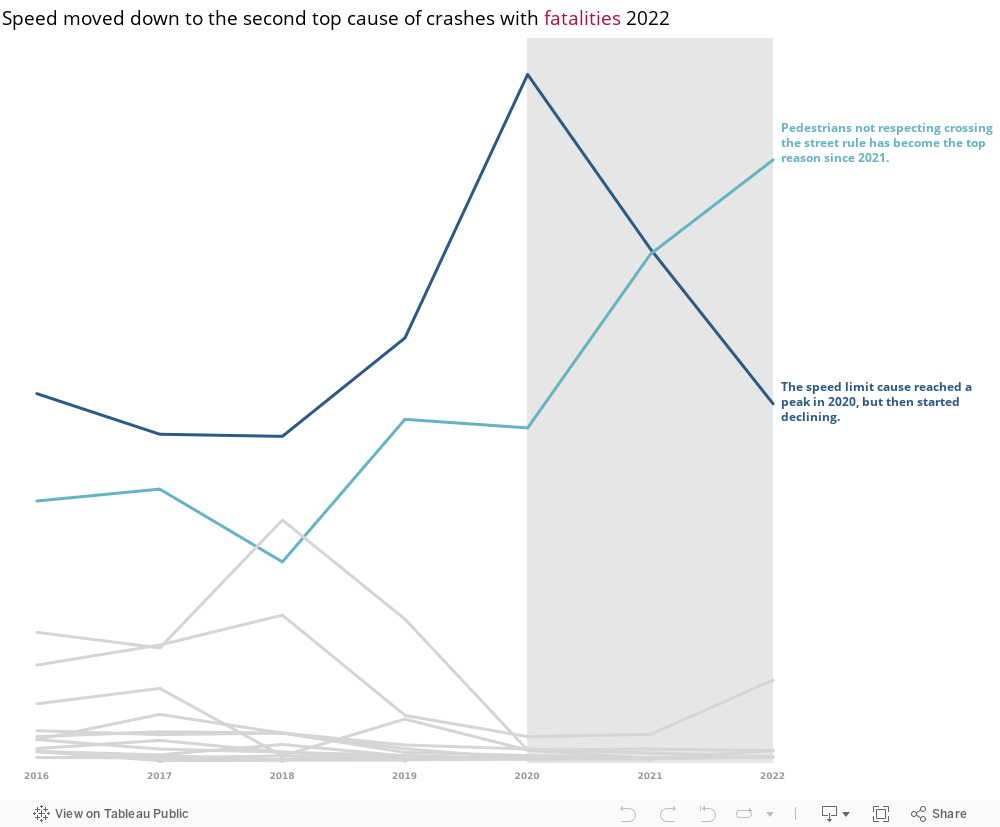
Now we are interested in checking the causes behind crashes with fatalities to understand what is happening. The figure below shows that there are two main causes of these crashes:
1- Driver not abiding by the speed limit
2- Pedestrian not abiding by crossing the street rules
As the above figure shows, pedestrians not abiding by crossing the street rules has become the top cause leading to crashes with fatalities.
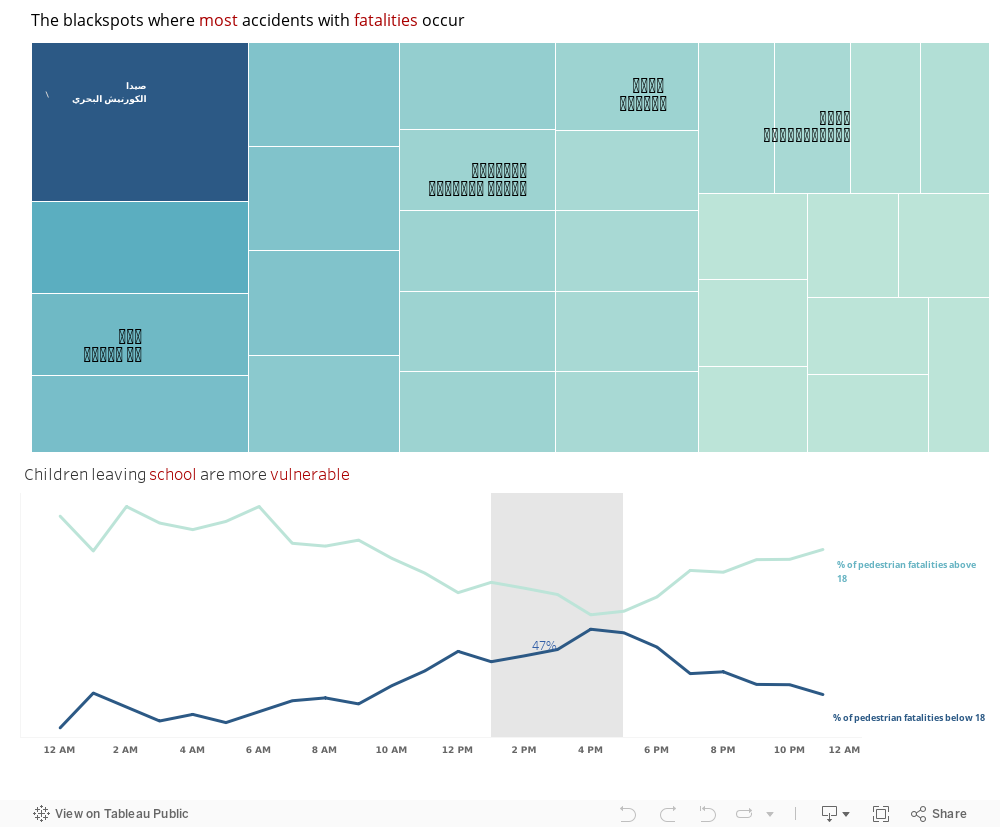
Now let’s keep this in mind and check for “blackspots” or spots with high crashes leading to fatalities to understand what is happening.
The figures below show that:
1- There are several blackspots in Lebanon, 5 of which are common findings with ISF Lebanon. After checking all 5 locations, we found out that all have a structure similar to highways.
2- The percentage of pedestrian fatalities among children reaches its peak between 2 PM and 4 PM – end of school hours time.
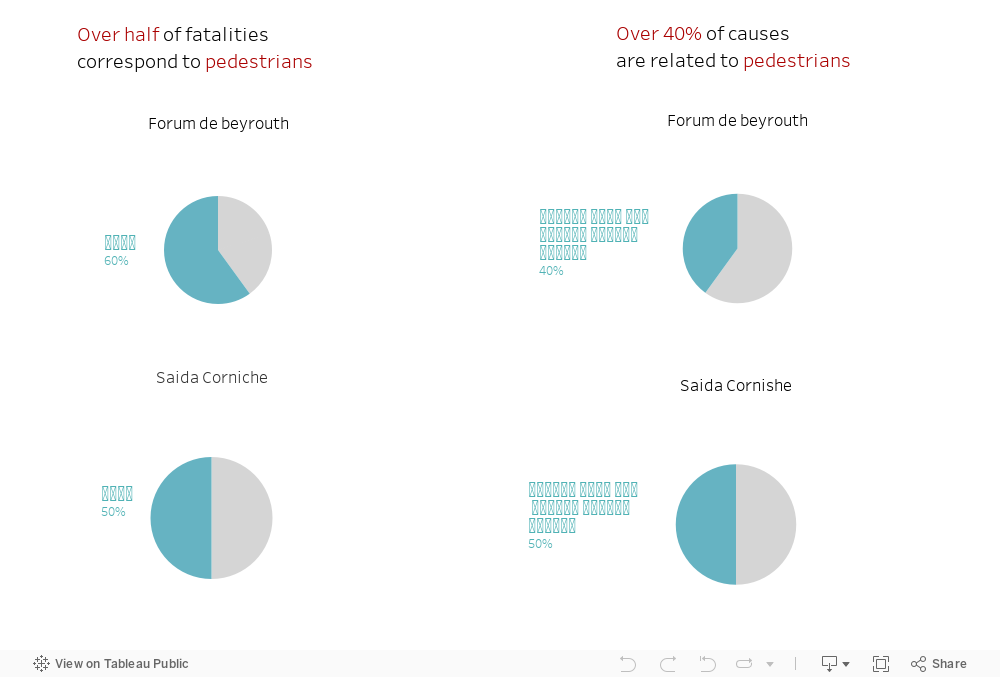
Now, we need to check what is the most vulnerable population (that has the highest fatality rate) and what is the main cause of such crashes. We do so by focusing on two of the blackspot locations: Saida (الكورنيش البحري) and Carantina (فوروم دو بيروت).
When drilling down into the two blackspots, we realize the following:
1- Pedestrians constitute at least 50% of the fatalities.
2- At least 40% of ‘Cause of Crash’ is: Pedestrian not abiding by street crossing rules, a cause discussed earlier above.
But here a question arises: Does this sound as if we are over-blaming pedestrians? What rules are we talking about? Does the street situation in Lebanon, facilitate crossing the streets for pedestrians? As we all know, in most cases, the answer is no, we don’t. Then, what could be done?
Since we all know the economic situation in Lebanon, we are here to offer low-budget approaches that are applied in other countries and have proved their efficiency:
1- Turn on traffic lights, at least those that are on junctions and cross points. This could be done in collaboration with civil society and NGOs that would be pleased to help by providing electricity supply through their private generators or solar stations; some initiatives have already been done.
2- Paint specific locations where pedestrians need to cross roads by Zebra Crossing in order to signal for cars to slow down and pay more attention to pedestrians.
3- When it comes to needed areas around schools, add school warning signs. Traffic police could also help during out-of-school hours on certain roads.
The figures below provide examples of what has been discussed earlier.
In addition to the above-stated on-ground actions, spreading awareness is a key action that could be performed at different levels targeting different age groups, starting from intensifying road safety topic in school programs at early age stages, reaching to broadcasting awareness campaigns that target older age groups.
Acknowledgement:
All data used for this blogpost is retreived directly from ISF who has thankfully collaborated and provided the data needed covering years 2016 – 2023.
In the spirit of collaboration, the incredible individuals behind this project:
Anthony Aramouny
Ghassan Shammas
Malak Wehbe
Mohammad Abdul Rahman
Rawad Abi Zeid
Zeinab Mortada
Prices Variation Rational
Commodities price variation in Lebanon has been the center of many socio-economic activities and concerns in the past 2 decades. In fact, notwithstanding the underlying concept of inflation (or deflation), the issue has a deep social stability construct: Food security for the poor and the poorer. No matter what the GDP is per capita, it is essential to understand that when commodities prices vary a substrate of the Lebanese society feels the impact much stronger than others: those below the line of poverty.
The Problem
Relying on the data published by www.humdata.org on the yearly prices of goods in Lebanon, it is clear that the consumer encounters prices variation, within the same period of time between the different regions in Lebanon. This is clear in the visuals published below.
We believe that the problem resides in the following issues:
Lebanon lacks sufficient personnel involved in the prices control at the economy of economy and trade.
It has Limited reach on price controls and prices ceiling.
It Lacks specialized domestic food security experts.
It lacks total agricultural programming to supplement the market with commodities in crisis.
It lacks cheap national transport routes for bulk products such as railways. The cost of transport may exceed 30% of the final cost of a commodity.
Details
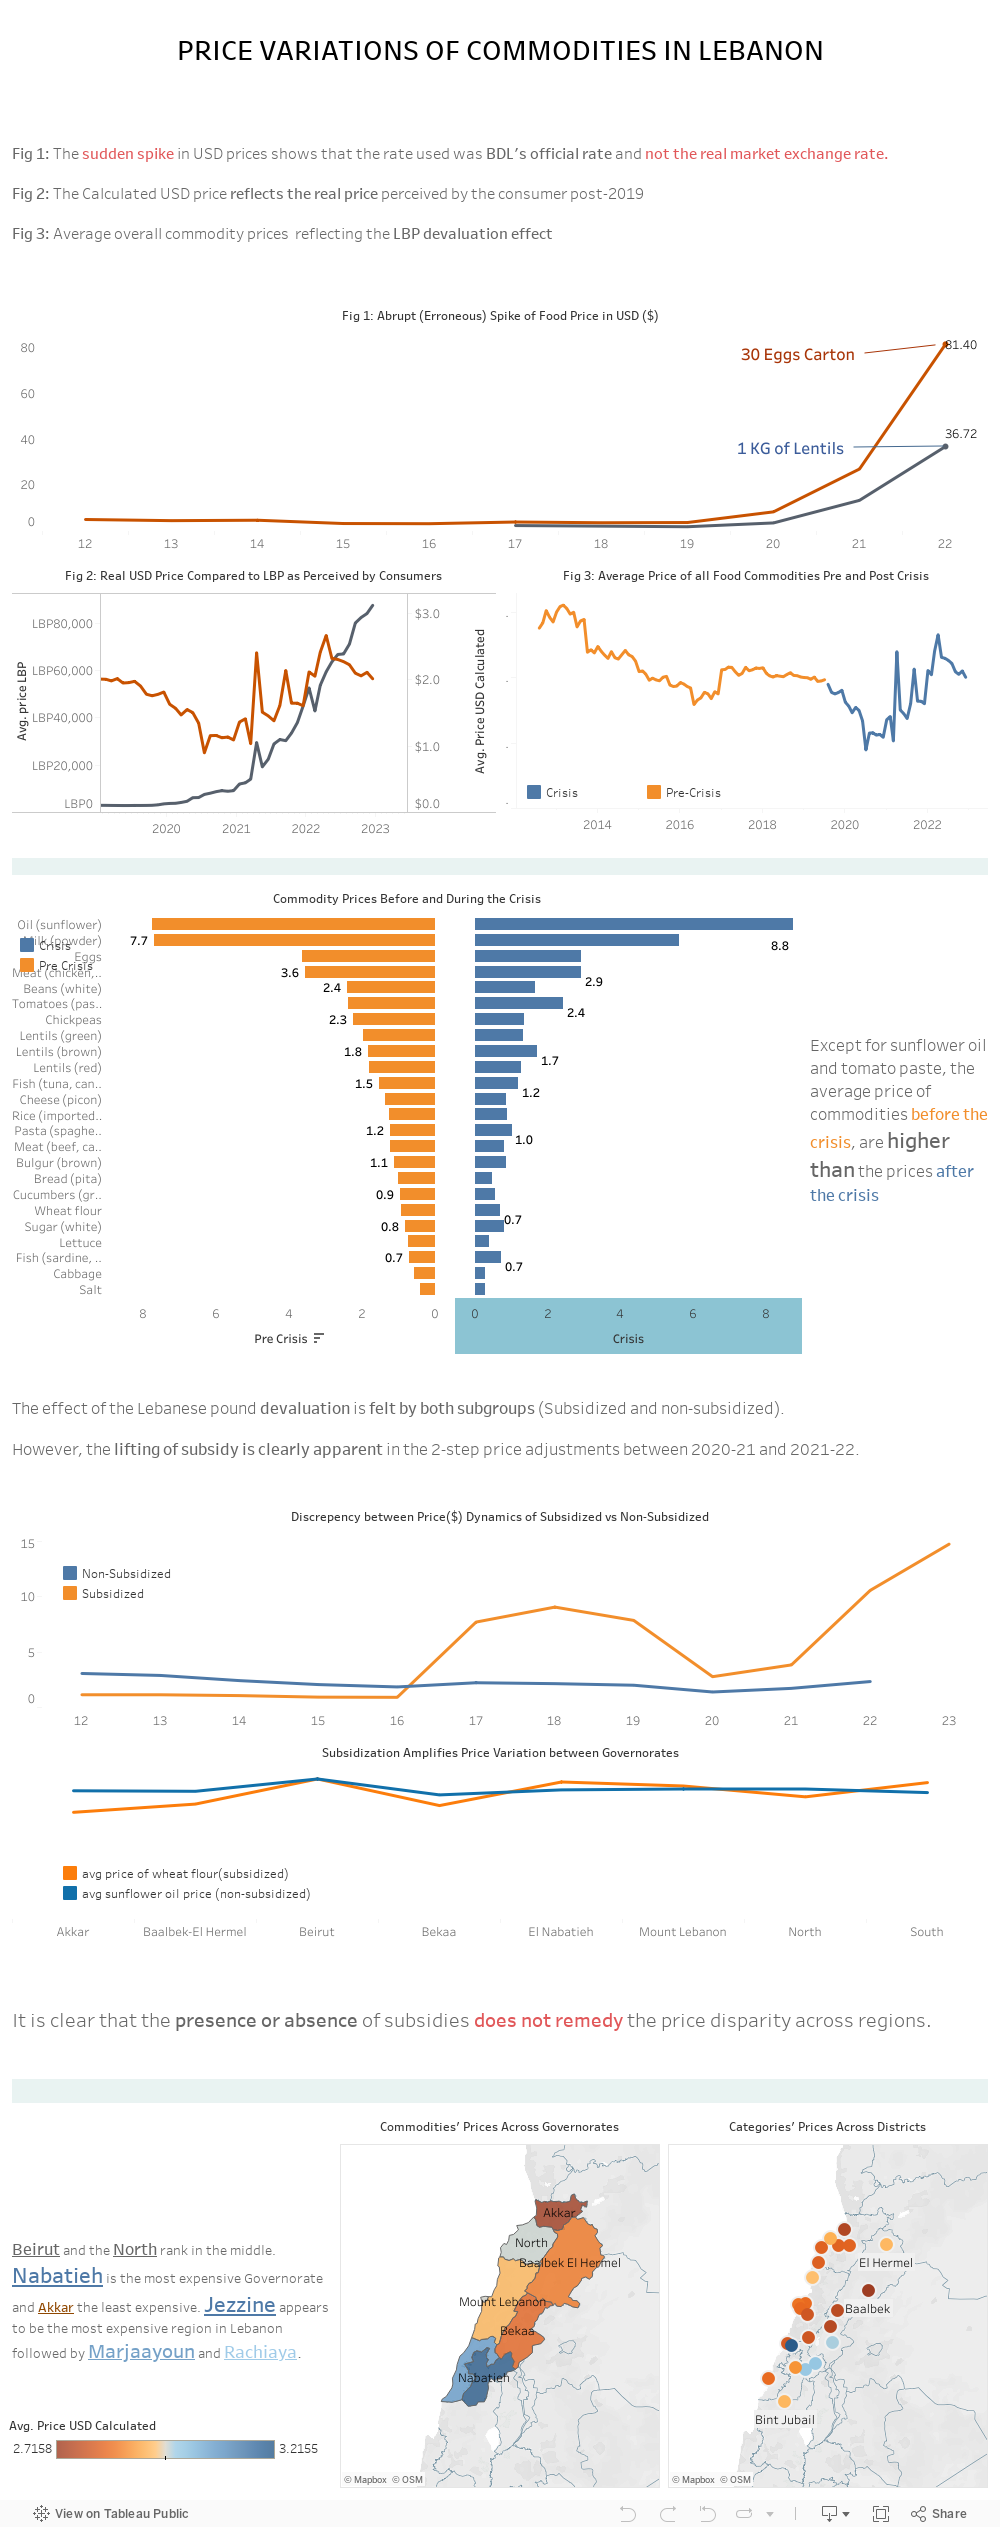
It is necessary to divide the time series into 3 periods:
From 2012 to October 2019 i.e. precrisis period
From October 2019 until end of 2021 (crisis period with subsidized goods)
2022 until now, post crisis and post subsidies.
The banking and financial crisis in Lebanon imposed mainly two constraints on the food security issue: i) the strong volatility of the exchange rate against a fixed low official rate of LB1500/$, ii) a subsequent spiraling inflation rate that was strongly reflected on the prices of goods in the country.
Meanwhile, during the first 2 years of the crisis, the government had subsidies on fuel and its derivatives, wheat and bread and some other commodities. The subsidies were lifted during 2021, and the prices were” floating”. For a short period of time, the prices oscillated without any rational and later stabilized due to the rapid dollarization of the retail market: The Lebanese Pound became almost obsolete, superseded by the US$ as a cash for retail transactions. It is to be noted that the salary of the public sector is still indexed to the “old” Lebanese pound exchange rate and hence the public servant are actually those who suffer the most the impact of price variation in Lebanon. Explore Our Interactive Dashboard below: For a more in-depth look at our project, we invite you to explore our interactive dashboard. It’s designed to provide you with detailed analytics, and visual insights into our work.
We value your thoughts and feedback! If you have any questions, comments, or insights, please feel free to share them in the comment section below.
You are probably aware of the United Nations 2030 Sustainable Development Goals. As a High School College Admissions and Career Guidance Counselor, you can play an important role toward achieving GlobalGoal 8, especially the target of full employment and decent work for all. You can help by providing students with data-driven advice about the jobs of the future. It’s important for students to think about their future careers not only in light of their interests, but also in light of which jobs are on the rise.
6 out of 10 workers will require training before 2027
The Future of Jobs Report by the World Economic Forum is one of the best publications that can help you provide students with scientific advice. It is a yearly publication, and the most recent version was published on May 2023. It brings together the collective perspectives of 803 companies, employing more than 11.3 million workers – across 27 industry clusters and 45 economies from all world regions. One of the most striking findings of the report is that 6 out of 10 workers will require training before 2027.This should give you an idea about the pace at which things are moving, and how drastic the landscape of the job market could be changing in the coming few years.
Cashiers, Waiters, Farmers, and Chief Executives are on the list of occupations with the largest job declines
You may have guessed that cashiers are on the list, but have you guessed that waiters and farmers are also on the list? How about Chief Executives? This is why you want reliable data and not intuition as the basis of your career guidance. One of the best resources that you can refer to is the Occupational Outlook Handbook by the US Bureau of Labor Statistics, particularly the Employment Projections (EP) which provides information about the US labor market for 10 years in the future. The Handbook is only about the US labor market, but it is still a very good resource that gives you insights into future trends regardless of where you are.
The 2022-2032 Employment Projections can definitely inform your high school students’ decisions when they start planning for their future careers. It gives an idea about which jobs are growing, and which jobs are declining.
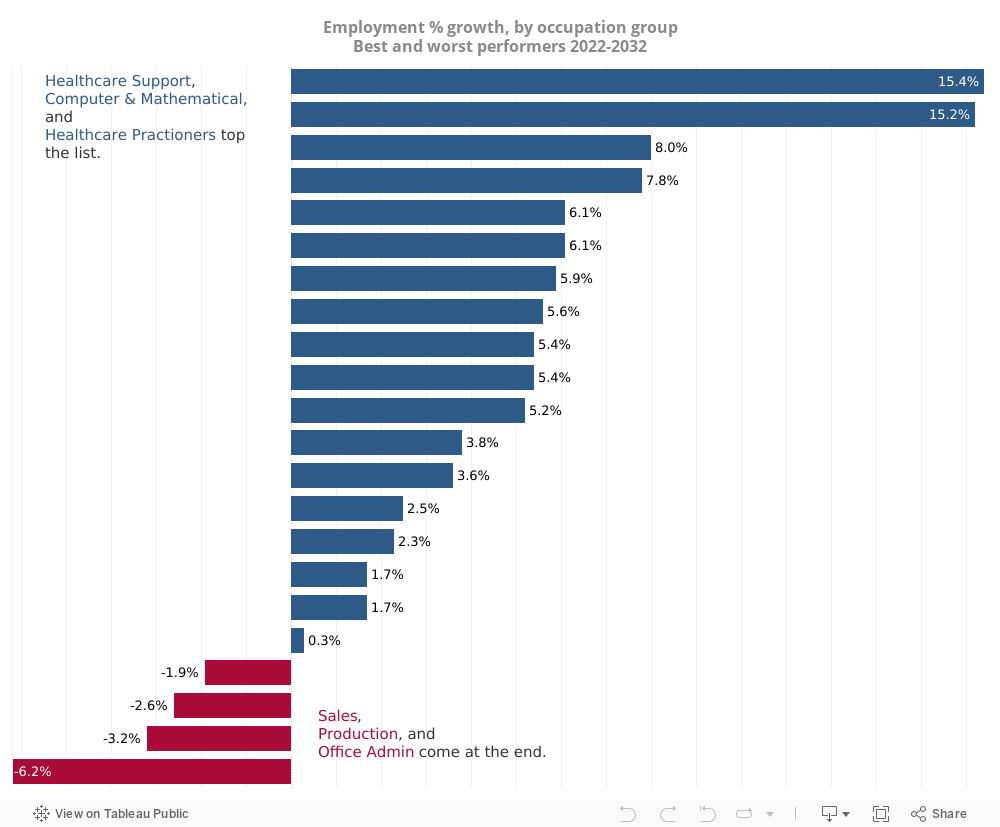
Healthcare and Tech are on the rise while Sales and Administrative occupations are declining
Let’s start with a macro-level picture of which occupation groups have the fastest percent growth, and which ones have the highest negative growth.
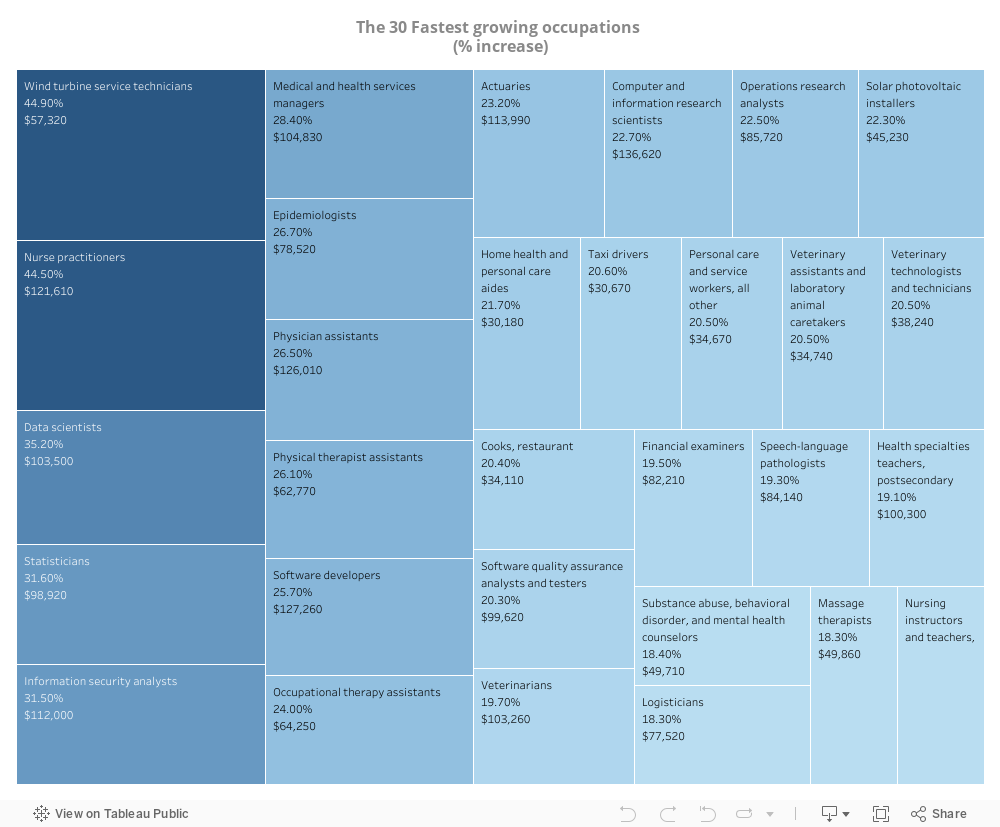
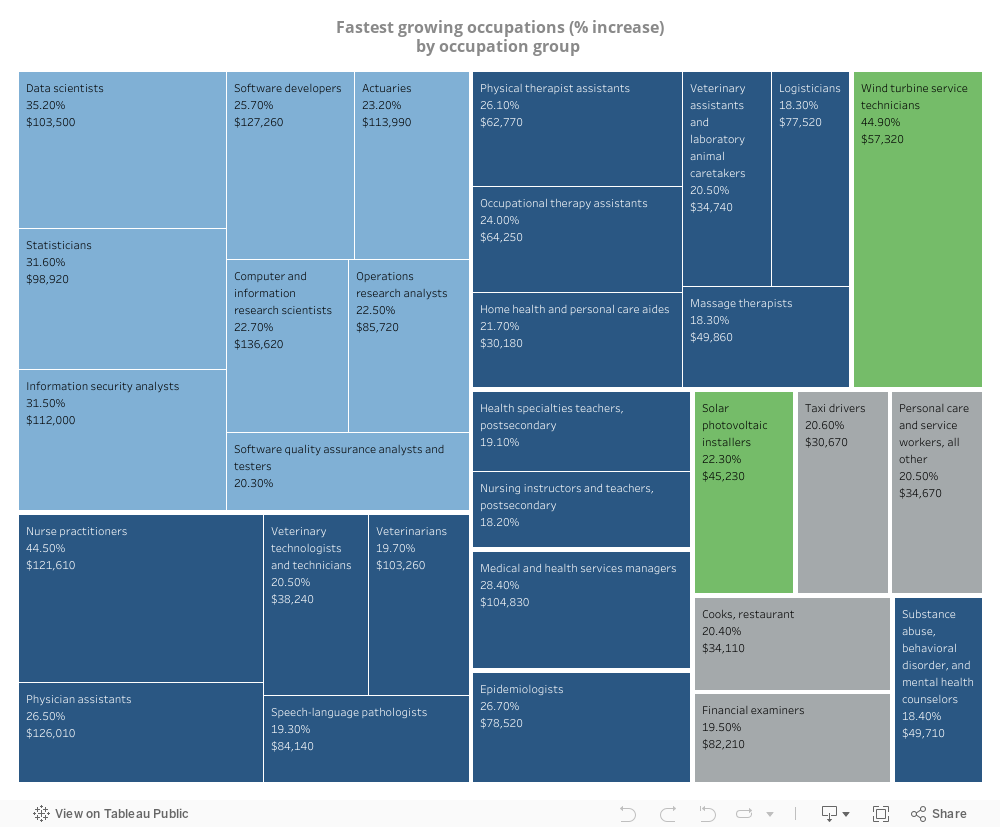
The fastest growing occupations
Now, let’s look more closely at the specific job titles with the highest percent growth, and let’s examine the median 2022 wage for these job titles. The top 3 places are: Wind Turbine Service Technicians, Nurse Practitioners, and Data Scientists. This is not very surprising because we know from the previous graph that healthcare and tech jobs are on top of the list of the most growing professions. We also know from the Future of Jobs report by WEF that green jobs are expected to grow more rapidly than other jobs which explains the presence of Wind Turbine Service Technicians on the top of the list.
Healthcare, tech and green jobs dominate the list
If we reorganize the treemap by occupation group, we’ll realize that 26 of the fastest growing jobs come from one of three categories; healthcare jobs (16), technology jobs (8), and green jobs (2). Looking closer at the list above reveals that there is a big discrepancy in the median annual wage among the the 30 fastest growing jobs. Computer and Information Research Scientists make a median annual wage of $36,620 in 2022, while Home Health and Personal Care Aides make only $30,180.
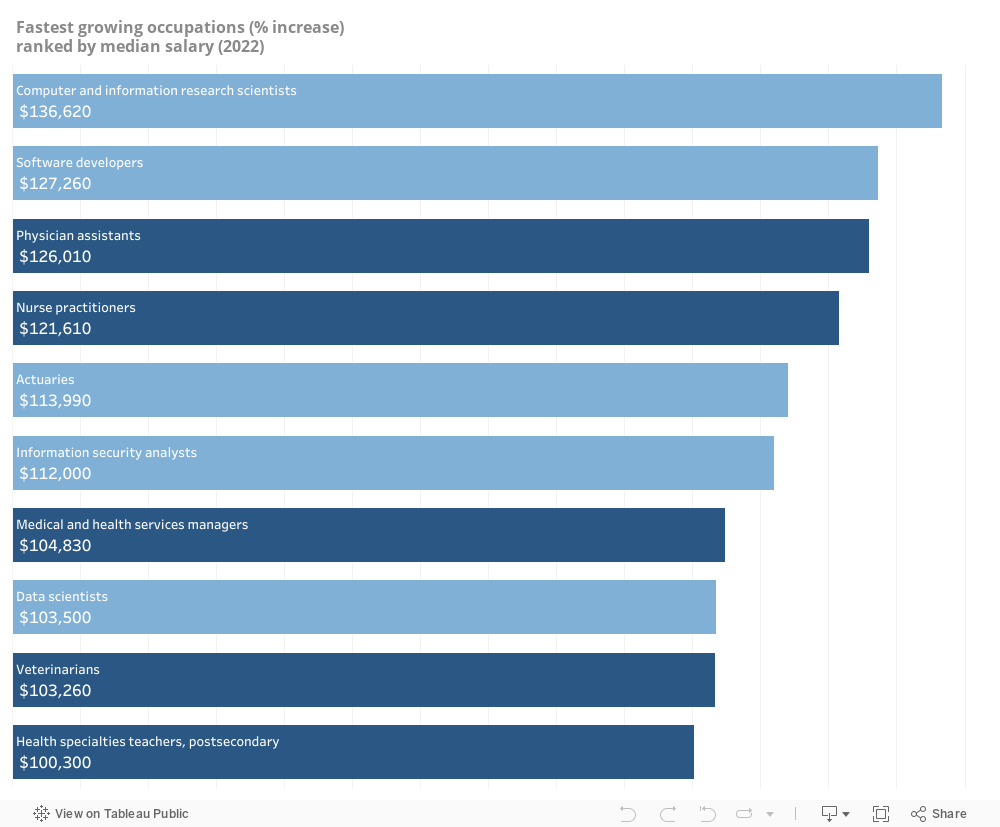
The top 10 paying jobs in the fastest growing occupations list
You are probably curious to know which fast growing jobs make the most money. Below is a list of the top 10 jobs in median annual wage among the 30 fastest growing jobs in the US. This list is now completely dominated by healthcare and tech jobs with equal share for both.
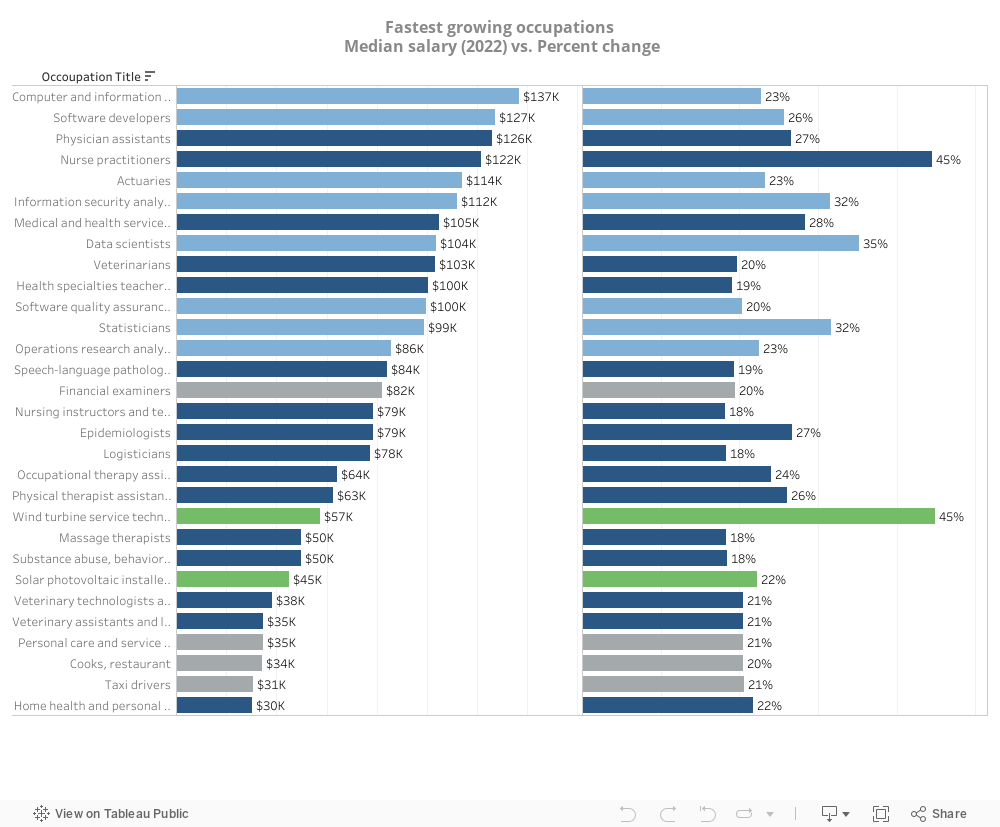
Below is the full list of the fastest growing jobs ordered from the highest median annual wage to the lowest, with the expected percent increase between 2022 and 2032. It looks like Nurse Practitioners will enjoy very high demand (45%) and a very high median pay ($121,610).
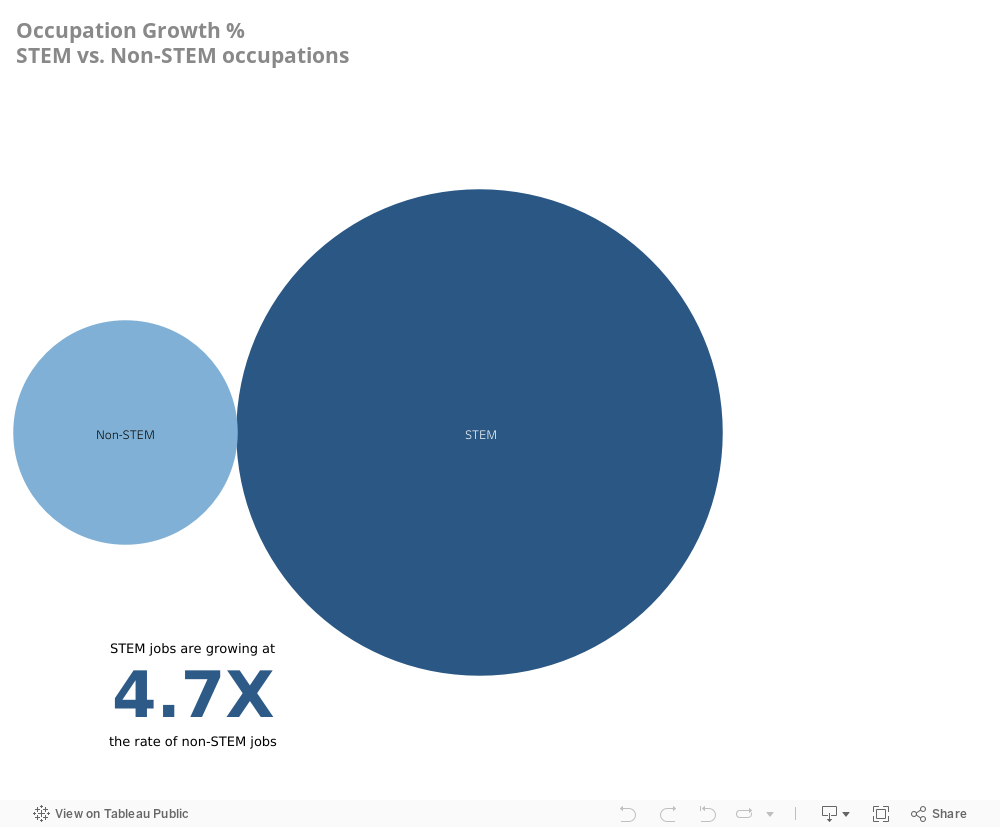
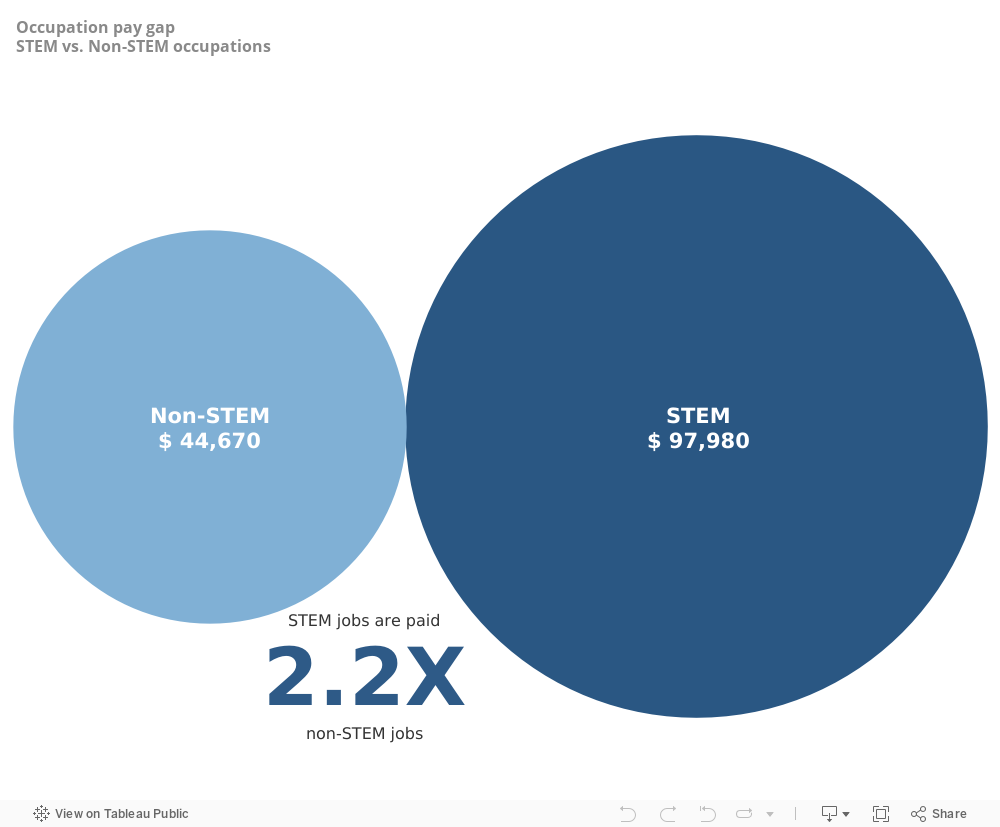
STEM vs no-STEM
It’s probably clear by now that there is a huge gap in demand and pay between jobs in Science, Technology, Engineering, and Mathematics (STEM), and non-STEM jobs.
STEM jobs are growing at 4.7X the rate of Non-STEM jobs.
STEM jobs are getting paid 2.1X as much as Non-STEM jobs.
It is in fact overwhelming to ask an 18-year old to choose his or her future career path, but isn’t that what happens when they write their college applications? Students are usually asked to select the major or at least the school (faculty) to which they would like to apply. While a student can always change his/her major in theory, things can get complicated in reality. Say a student is very interested in humanities and engineering. If the student decide to apply to a humanities major but later finds out about this pay gap between engineering and humanities after she is already enrolled in college, it may not be possible for her to transfer from the faculty of Arts and Sciences to the faculty of Engineering. So, it’s critical to provide students with all the information and allow them to take data-informed decisions that incorporate the future projections of the job market into consideration.
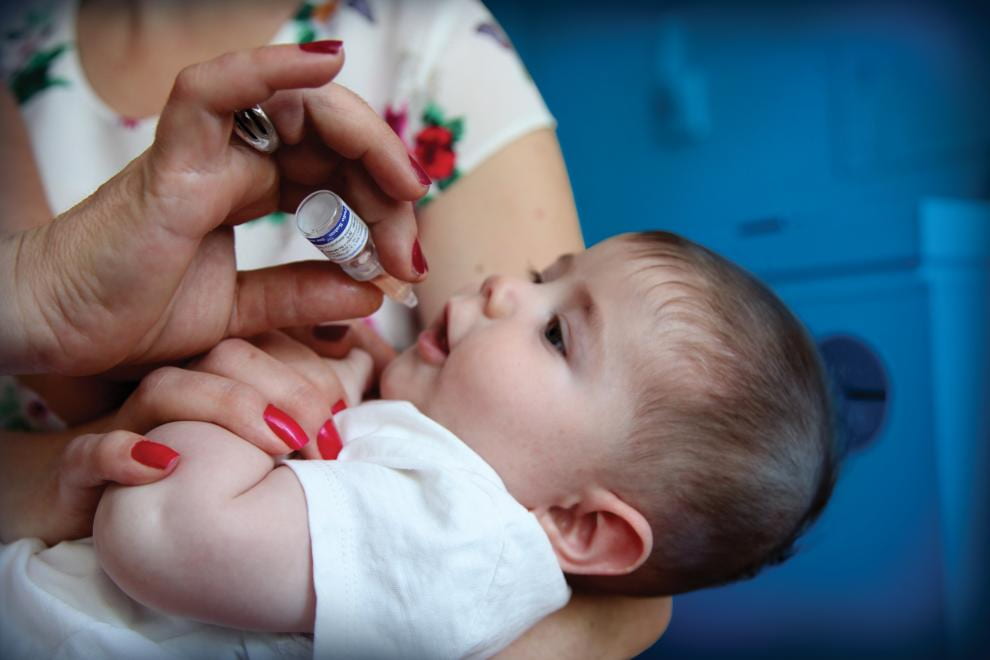
“As declared by the unitednations Health and well-being are important at every stage of one’s life, starting from the beginning from the very start.”
A pivotal measure that parents can undertake during the early stages of their children’s lives is to ensure they receive the necessary vaccinations. These vaccinations play a crucial role in preserving the health of the child and contribute collectively to the well-being of society.
A high vaccination rate in countries can lead to:
Decrease in individual’s Health Risks
Decrease in disease Spread and vulnerability to outbreaks
Reduce the strain on Healthcare Systems
Economic stability
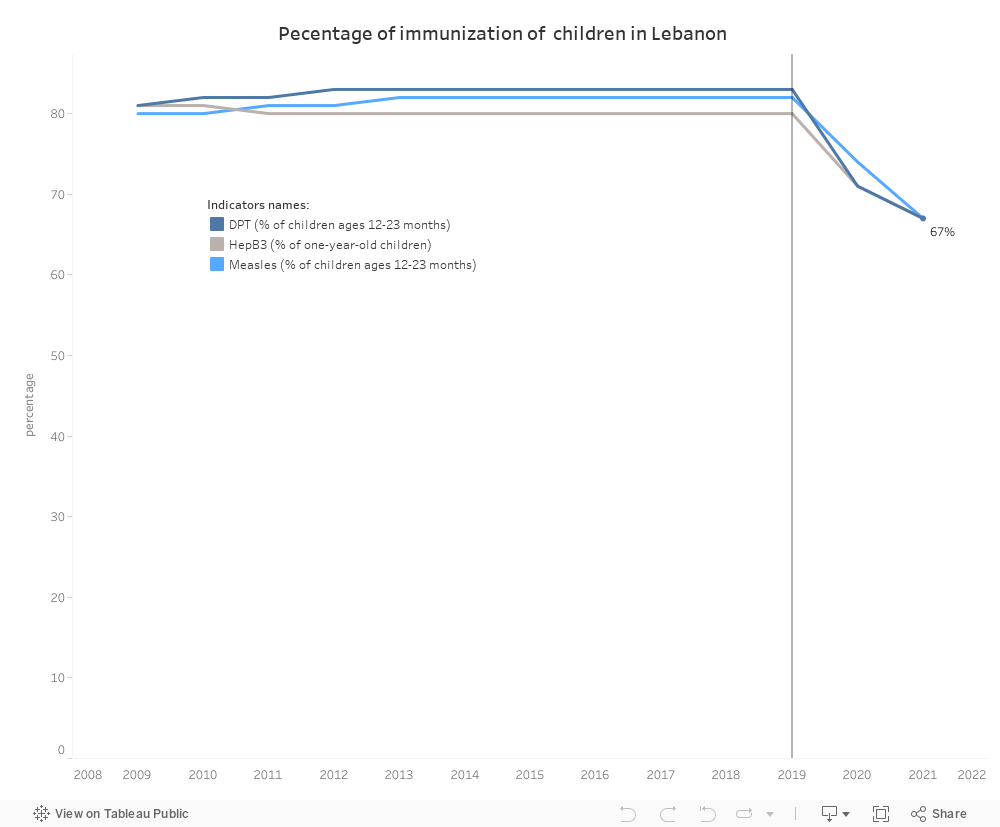
Alarming Drop in Immunization Rates Among Lebanese Children:
In 2020, Lebanon witnessed a substantial decrease in the percentage of immunization against Diphtheria, Pertussis, and Tetanus (DPT), Hepatitis B (HepB3), and measles among children aged 12-23 months. After more than ten years of stability, the immunization rate dropped to 67% in 2021, marking its lowest point in recent history.
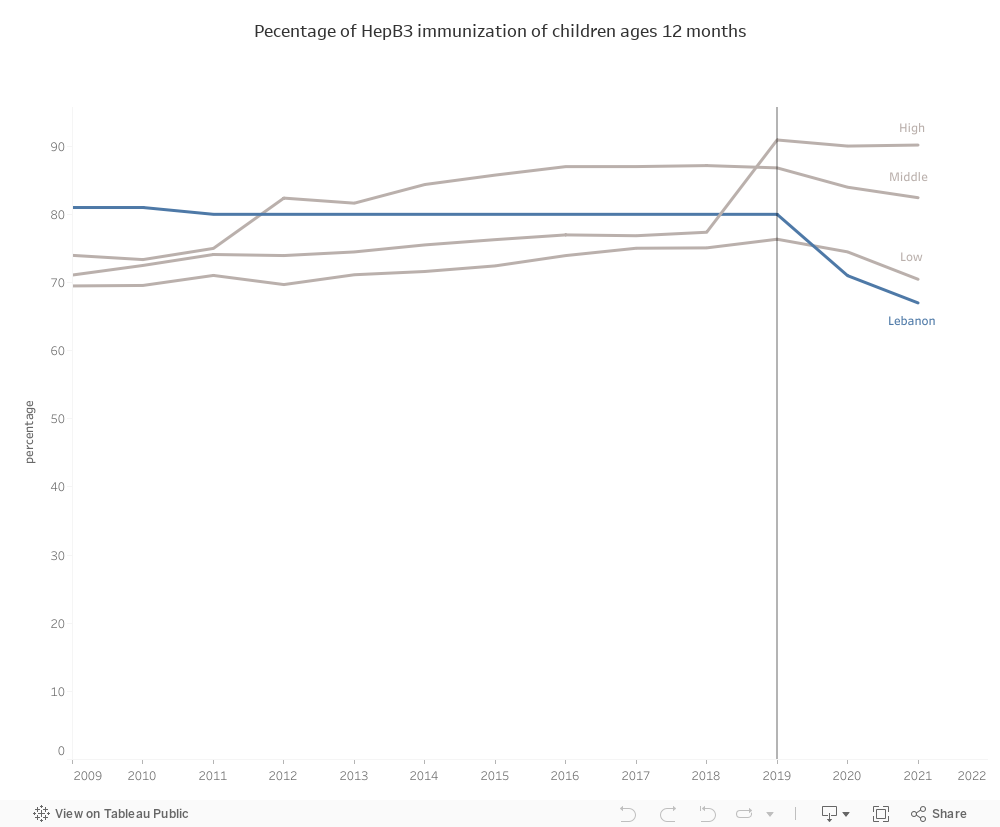
Standing Out in a Global Context of Decline:
While middle-income and low-income countries experienced a decrease in immunization percentages in 2019 and 2020, Lebanon stood out with the most significant decline. Comparatively, when pitted against low-income, middle-income, and high-income countries, Lebanon witnessed the highest decrease in the percentages of DPT, Measles, and HepB3 immunization during these pivotal years.
This raises crucial questions about the specific factors contributing to Lebanon’s distinct challenges in maintaining essential childhood vaccination rates.
Economic Struggles Impacting children Immunization:
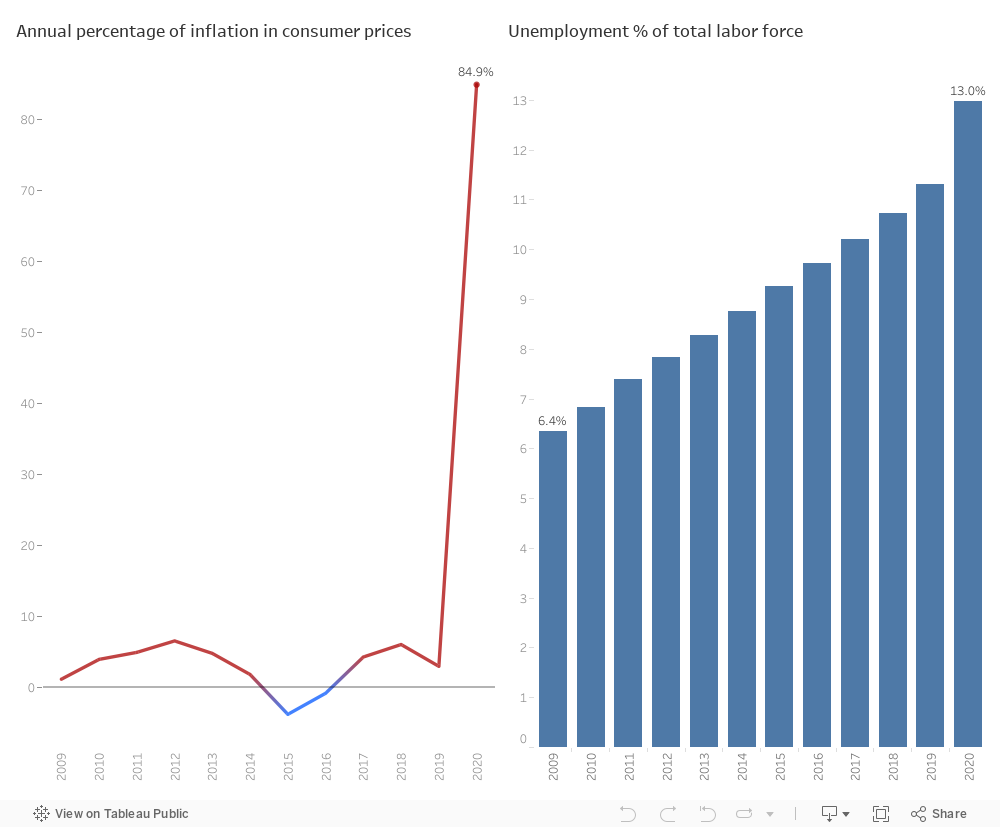
In 2019, Lebanon experienced a significant economic crisis, resulting in widespread job losses, with the unemployment rate reaching 13% by 2020. The cost of everyday items surged, approximately 85%, creating substantial challenges for individuals to afford medical expenses and seek necessary healthcare. Accessing healthcare has now become a luxury for many citizens, including children, as parents prioritize essential goods over vaccinations for their kids.
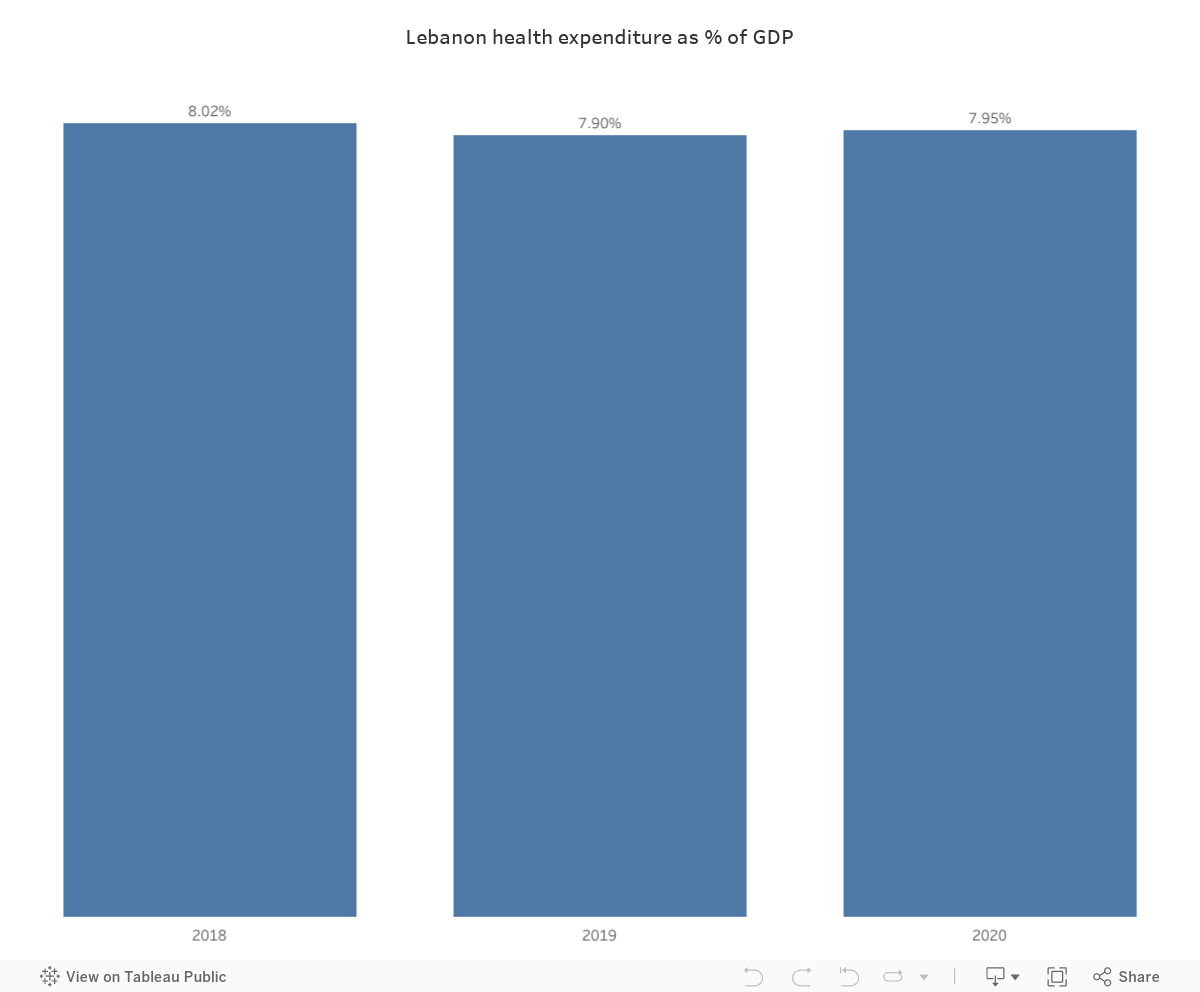
In addition, the Lebanese government allocated similar resources in Lebanese Lira to its healthcare system in 2019 and 2020 as it did in 2018. However, the impact of inflation eroded the purchasing power, diminishing the effectiveness of the government’s support, especially given that healthcare costs are often priced in US dollars.
Shielding the Health of the Lebanese :
In the world public health, the ramifications of low vaccination rates against DPT , Measles and HepB3 are far-reaching and dire. The repercussions extend from the heightened risk of individual health issues to the vulnerability of entire communities facing outbreaks. These outbreaks not only strain healthcare systems but also impose a substantial economic burden, creating a global health threat. The gravity of these consequences becomes most evident in the specter of preventable deaths looming over communities.
Recognizing the gravity of these consequences, urgent action is essential. The government must increase its investment in vaccination programs, ensuring free and universal accessibility. It should collaborate with international entities such as World Health Organization and NGOs to get financial support.
These efforts will not only promote individual well-being but also strengthen the communal defense against potential outbreaks, paving the way for a healthier and safer future for all.