“Most air pollution comes from energy use and production,” says John Walke, director of the Clean Air Project which is part of the Climate and Clean Energy program at the National Resources Defense Council. In fact, according to the World Health Organization (WHO), it is estimated that each year, air pollution is the major cause of the death of nearly seven million people on Earth. Air pollution has several causes such as:
Burning fossil fuels
Industrial emissions
Wildfires
CO2 and other greenhouse gases emissions
According to the National Institute of Environmental Health Sciences, it is estimated that deaths due to the devastated air quality will continue to rise till 2100 and the economic value of the health benefits was estimated to be between $50 and $380 for each ton of carbon dioxide emitted.
Ever since the industrial revolution, there was an outbreak of industries in all fields ranging from mechanical production to electrical to technical. All these productions relied mostly on heavy machinery that in fact, combusted energy sources (such as fuel, oil, diesel…) and in a complex series of chemical reactions, released gases. One of those gases is Carbon dioxide (CO2). CO2 by itself is not bad because it is a needed chemical in nature. However, CO2 levels in the air have been increasing drastically to the point that they have become one of the major sources in air pollution, according to MDPI.
Carbon Dioxide from electricity production:
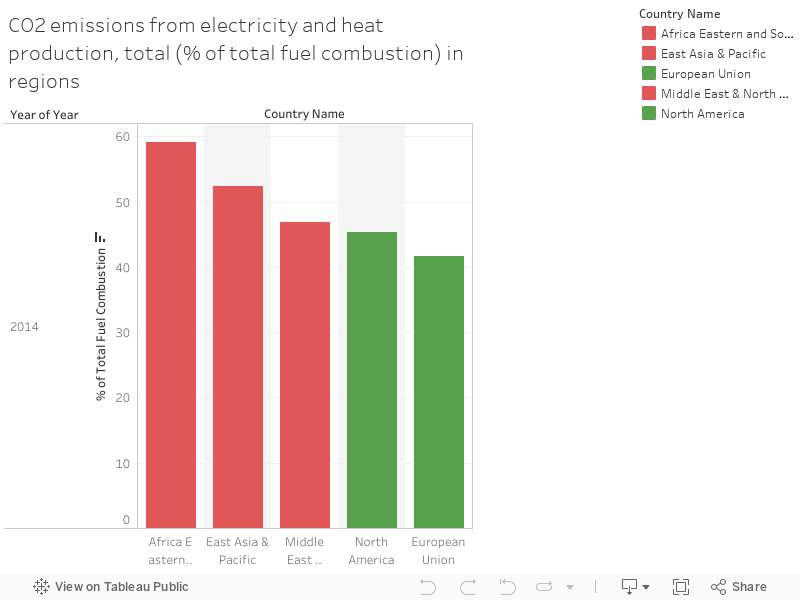
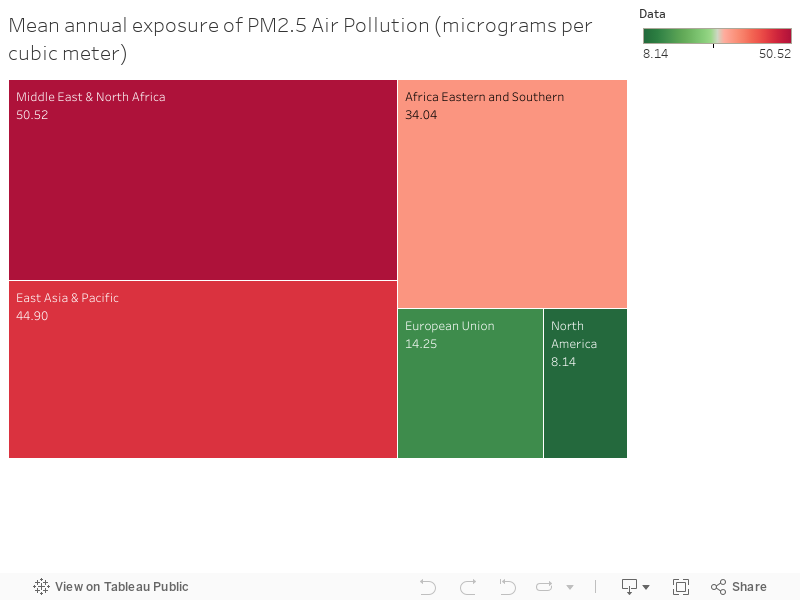
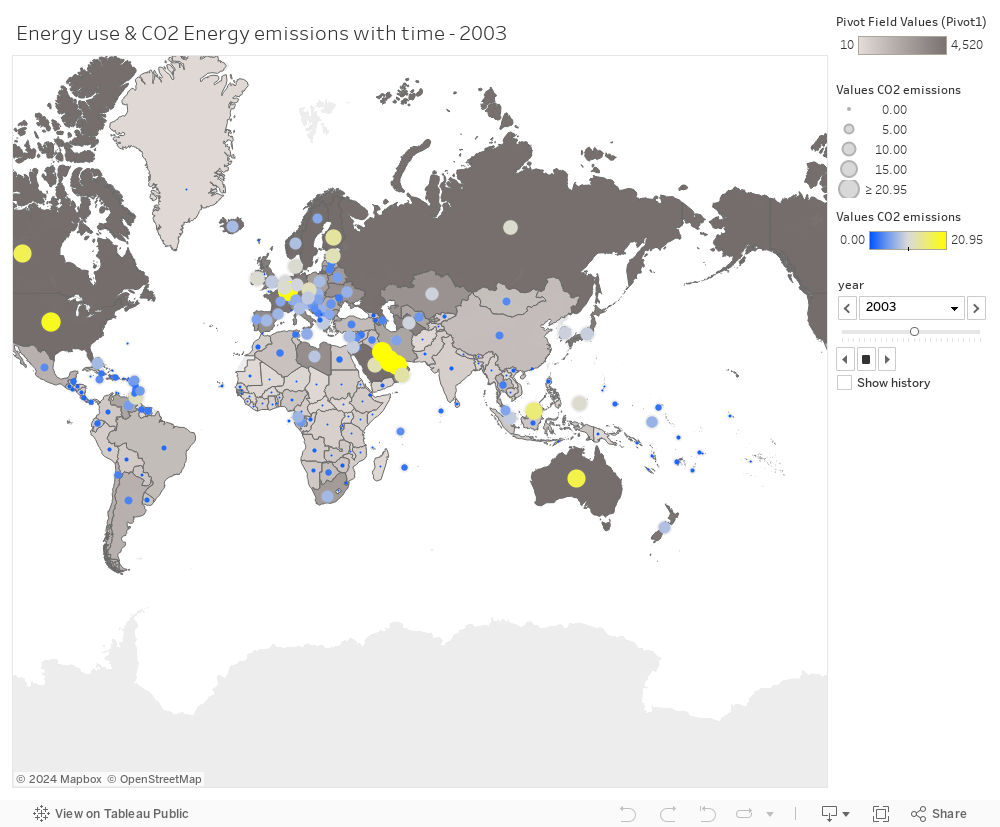
According to the World Nuclear Association, almost 40% of the energy-related CO2 emissions are due to burning of the fossil fuels for electricity production. Because a huge part of electricity production depends on burning fuels, there will be a mass of CO2 emitted to the air. This in turn leads to high CO2 emissions, especially from the countries that depend completely on burning fuels to produce electricity. The visuals below demonstrate and prove that the regions that had the highest CO2 emissions from electricity and heat production in 2014 tended to have the highest air pollution rates. The Carbon dioxide emission rates were highest in the middle east, east Africa and east Asia compared to the low numbers of North America and Europe. The same former countries had the highest air pollution rates (PM2.5) compared to the latter. Therefore, we can conclude that the higher the dependency on fuel combustion for energy production, the higher the CO2 emission rates, the higher the air pollution rates. On the long run, this can have devastating effects on the nature, climate and humans.
What can be done?
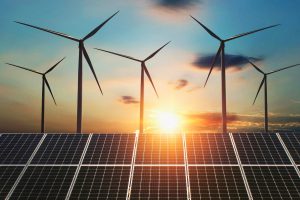
After governments realized the devastating effects of the gaseous emissions on the air quality and on humans in general, several attempts were done, such as awareness programs among the youth, restrictive laws and advertising. However, these attempts tackled the tip of the iceberg of the problem. A solution is needed to solve the problem deep from within the roots, to prevent it from happening in the first place. Producing energy from renewables could be a potential solution. The most common renewable power technologies are through Solar, wind, biogas, geothermal, low-impact hydroelectricity and biomass. According to the Environmental Protection Agency, generating energy from renewable sources reduces air pollution, diversifies energy supply and creates economic development.
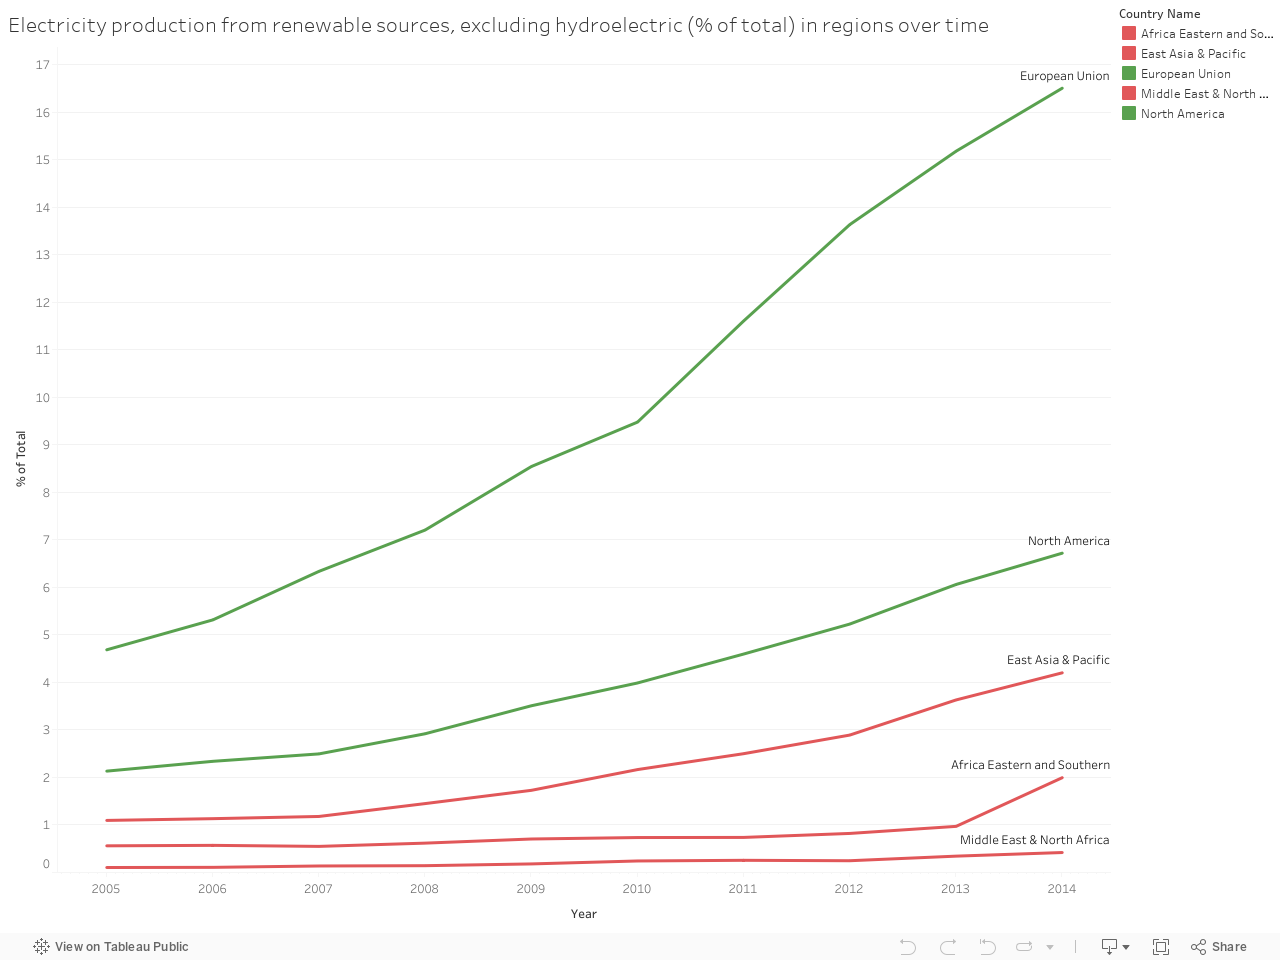
To reduce the gaseous emissions and air pollution, several countries tried to develop their technological and scientific knowledge of renewable energy production as saw a promise in using renewables, that could one day, be substituted for fuel combustion to produce energy. In fact, developed countries such as USA and the EU countries took serious initiatives to use renewable energy production. The below figures show that countries that increased their electrical energy production from renewable sources over the time period of 2005-2014 had the least air pollution rates in 2014. The EU countries and North America had the highest dependency on using renewables to produce electricity compared to the middle east, east Africa and east Asia and the former regions in turn had air pollution rates that are much lower.
Renewable energy production, therefore, is a clean energy source that can reduce Carbon dioxide emissions and in turn lead to a better, sustainable and a healthy planet that has a rich and high air quality.
The Sustainable Development Goal 3 of the 2030 Agenda for Sustainable Development is to “ensure healthy lives and promoting well-being for all at all ages”.
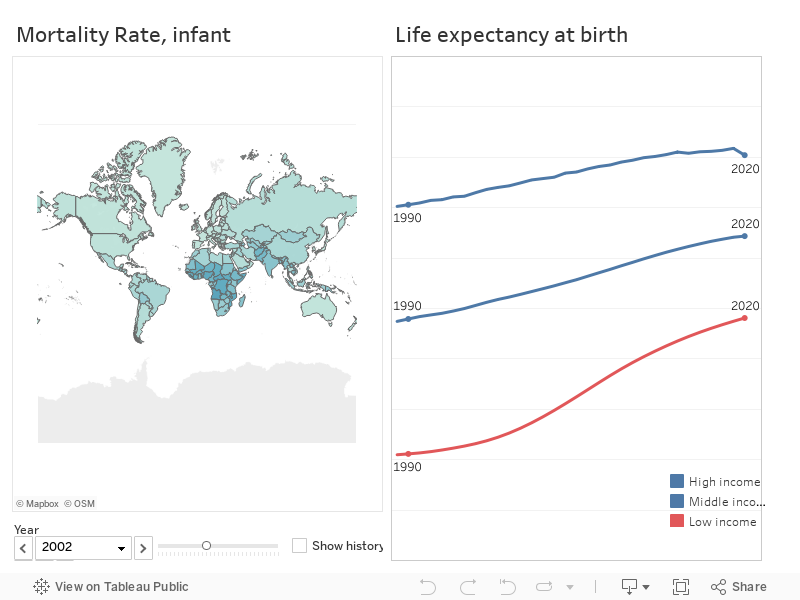
However, many low- and middle-income countries are having higher mortality rate for infant and lower life expectancy in general compared to other higher income countries.
Infant mortality is the death of young children under the age of one. The infant mortality rate (IMR) is the number of infant deaths for every 1,000 live births.
The first map shows the IMR of most countries around the world. It changes by years. From the map, we can see the global IMR has decreased from 1990 to 2021 and is predicted to continue to decrease in the future However it’s still higher in low-income countries.
Infant Mortality Rate is an important indicator of the overall health of a society. It also reflects the social, economic, and environmental conditions in which children live. There are a number of causes of infant mortality that vary from country to country, including poor sanitation, poor water quality, malnutrition of the mother and infant, and inadequate prenatal and medical care.
Visualizing the data from the World Development Indicators (WDI) throughout different years shows clearly that there is inequality in health, clean resources and vaccination coverage as well.
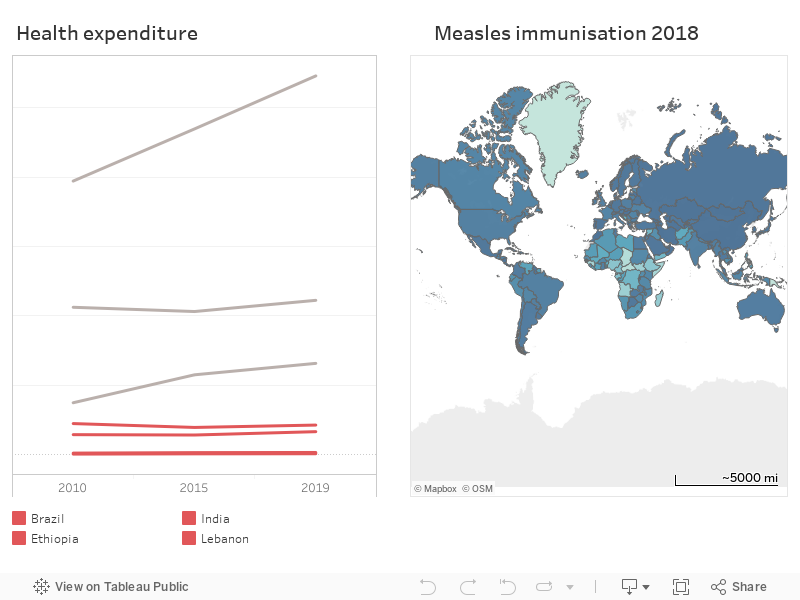
One of the main reasons for the high IMR is the lack of vaccination, taking Measles as an example, Measles is a highly contagious, serious disease caused by a virus. Before the introduction of measles vaccine in 1963 and widespread vaccination, major epidemics occurred approximately every 2–3 years and measles caused an estimated 2.6 million deaths each year.
More than 140 000 people died from measles in 2018 (over 300 deaths a day) mostly children under the age of 5 years, despite the availability of a safe and effective vaccine.
Due to gaps in vaccination coverage, in high income regions of the world such as Western Europe, measles causes death in about 1 in 5000 cases, but as many as 1 in 100 will die in the poorest regions of the world.
Another important fact to focus on is the Health expenditure per capita which is the amount that each country spends on health, for both individual and collective services.
We notice that the low-income countries have the lowest rate compared the other countries such as US and Finland.
This prevents many women of the low-income countries from getting proper and adequate medical attention due to their inability to afford good care
This is also another reason for the high Infant mortality rate in these countries because they don’t give much importance and budget for the country health system
Recommendation:
There are different causes of infant mortality that vary from country to country, including poor sanitation, poor water quality, malnutrition of the mother and infant, Vaccination and inadequate prenatal and medical care. So, in order to reduce the rate, it’s necessary to enhance the standards of living in these countries on different levels:
Measles vaccination for children, combined with mass immunisation campaigns in countries with high case and death rates, are key public health strategies to reduce IMR
Improve life conditions by providing an access to a cleaner food and beverage.
Increasing the delivery services within health facilities
Health expenditure need be prioritized by laws: Countries that have prioritized policies on health-care expenditure and have high levels of health spending are those that have succeeded in lowering their infant mortality rates
Encourage NGOs and the other organization to create projects in these countries for employability purpose and providing solutions to the people’s needs.
Validation
Monitor the world development indicators (e.g., Infant mortality rate, access to clean food, immunization, GDP,, …) in such countries over the next period and see with how much and how these indicators changed after doing these solutions.
Findings/Recommendation
Reducing mortality rate may lead to Improving labor supply resulting in improved household income and economic well-being of families and communities.
Trying to reduce inequality between high- and low-income countries will empower and promote inclusive social and economic growth
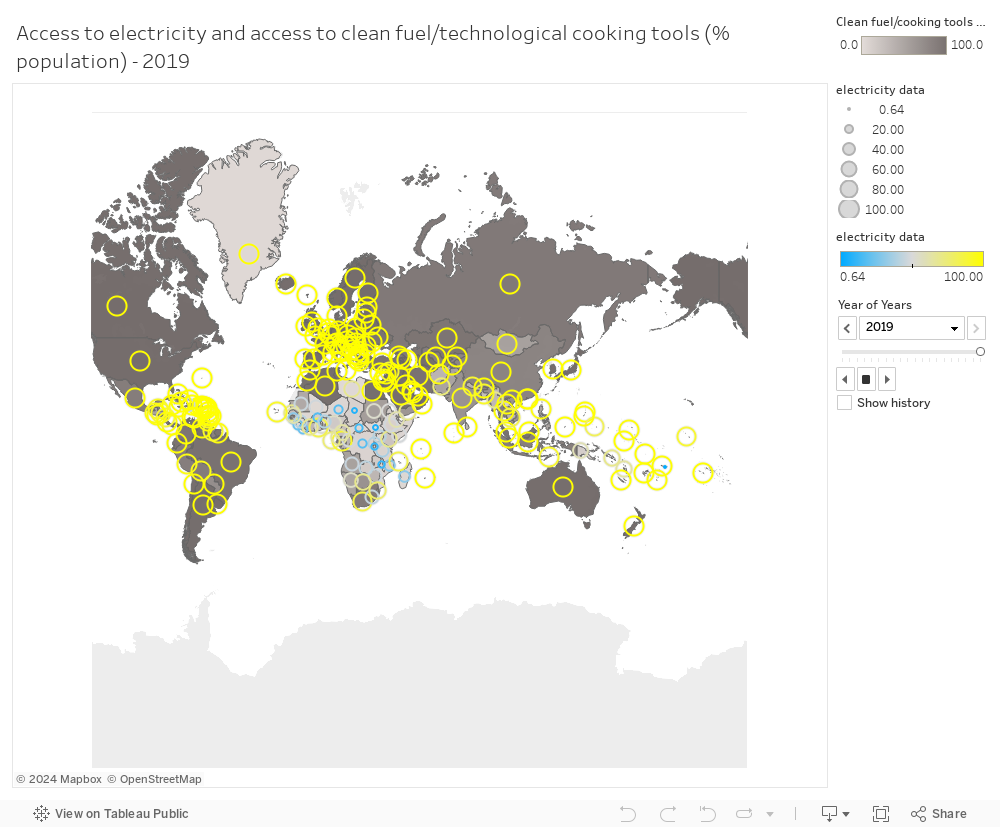
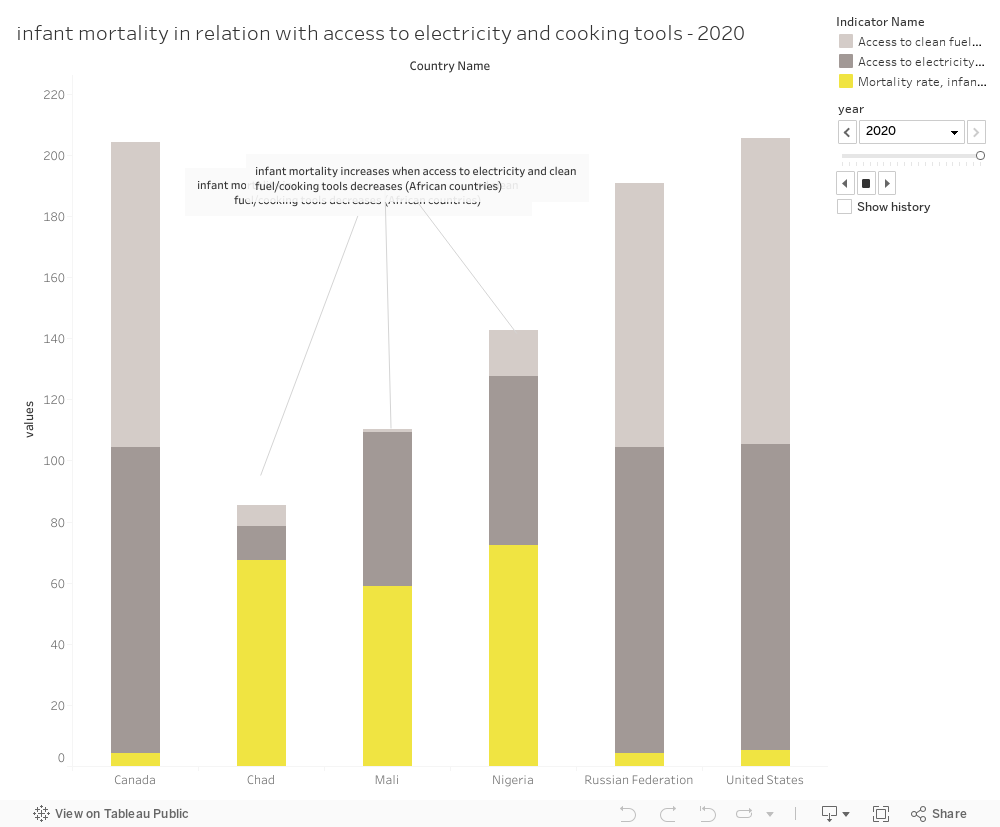
Unavailability of electricity and cooking tools is prominent, especially in African countries. On the community level, this can be responsible for inadequate equipment in health care facilities. On the individual level, this causes hunger and reliance on combustion methods for cooking and heating which increases exposure to unhealthy air substances.
Evidence: infant mortality is the highest in African region while both access to electricity and technological tools for cooking is the lowest in these countries.
Solution:
– On the community level: Projects to electrify health care facilities especially emergency care (refrigerators for storing medicines and plasma, communication systems…).
– Individual level: projects to Increase accessibility to technological cooking tools.
Solution details:
-Projects to electrify health care facilities increase attraction and retention of health care practitioners in the African region, also ensure better provision of health services.
-Providing clean energy decreases reliance on combustion methods for cooking and heating, decreasing indoor air pollution.
-Ensuring provision of cooking tools optimizes cooking time and decreases various coping strategies and these may include the decreasing the frequency cooking of foods that take longer to cook such as beans or encouraging consumption of uncooked or semi cooked foods), decreasing malnutrition.
Validation:
More than 5 lives out of 100 lives are saved through providing better services including electricity and clean fuel for cooking for more than a year, according to Wang and Van der Klauuw, 2003.
Recommendations:
– The focus of energy programs should shift from supplying energy as a commodity to providing energy with a developmental goal, such as clean energy for child health or water and sanitation.
– Focus should be on identifying conditions under which affordable energy services creates gains in combating child mortality.
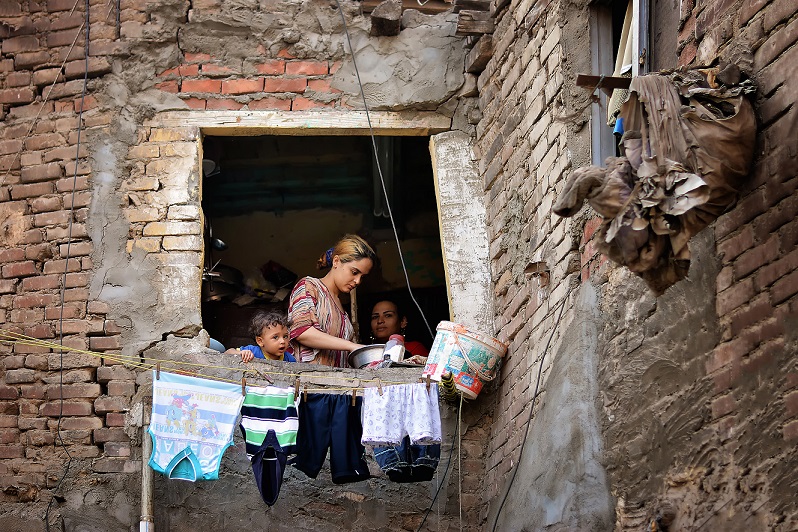
Wassim, Nathalie, and Imad; three individuals who were pushed out of work by the deteriorating economic conditions in Lebanon. Tens of thousands of people like them have been suffering daily for the past 3 years living from paycheck to paycheck up until they were forced out of it (work). Lebanon has witnessed what no other country has. Unemployment rates doubled in only a decade, COVID-19 took out thousands, and inflation bankrupted hundreds of businesses.
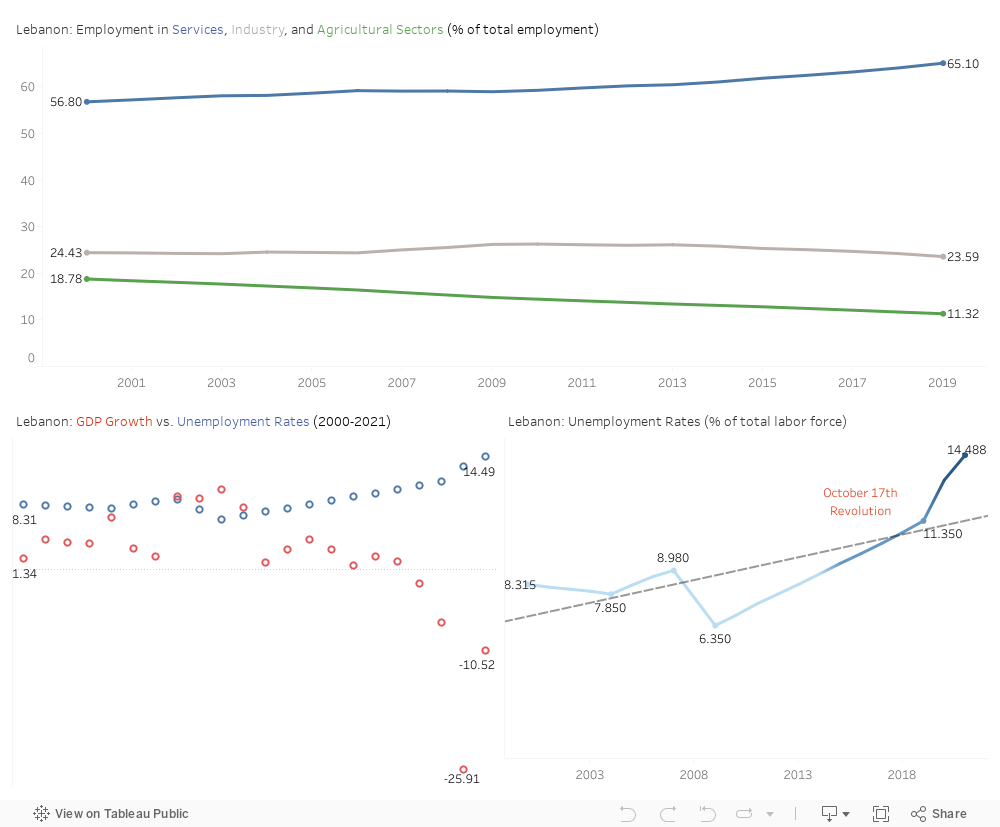
According to Okun, a very low or negative growth in GDP leads to a rise in unemployment. By observing this visual, we can see how unemployment skyrocketed while GDP growth took a deep dive. Comparing the years 2008 and 2009, GDP growth increased 10.23 percentage points while unemployment rates decreased by 6.35 percentage points. We can conclude an inverse correlation between GDP growth and unemployment. Another observation is that between years 2020 and 2021, GDP growth increased by almost 15 percentage points. Despite this growth, unemployment remains significantly high at 14.49 percentage points. Importantly, this project is action-oriented in that it shows the nexus between unemployment and GDP growth #SDG8, which are intrinsic to an economy, from more “policy-driven” factors that can be addressed, improved or mitigated.
Here, a question rises? What is the cause for the disproportionality between GDP growth and unemployment rates? There are 3 possible causes for its inverse relation:
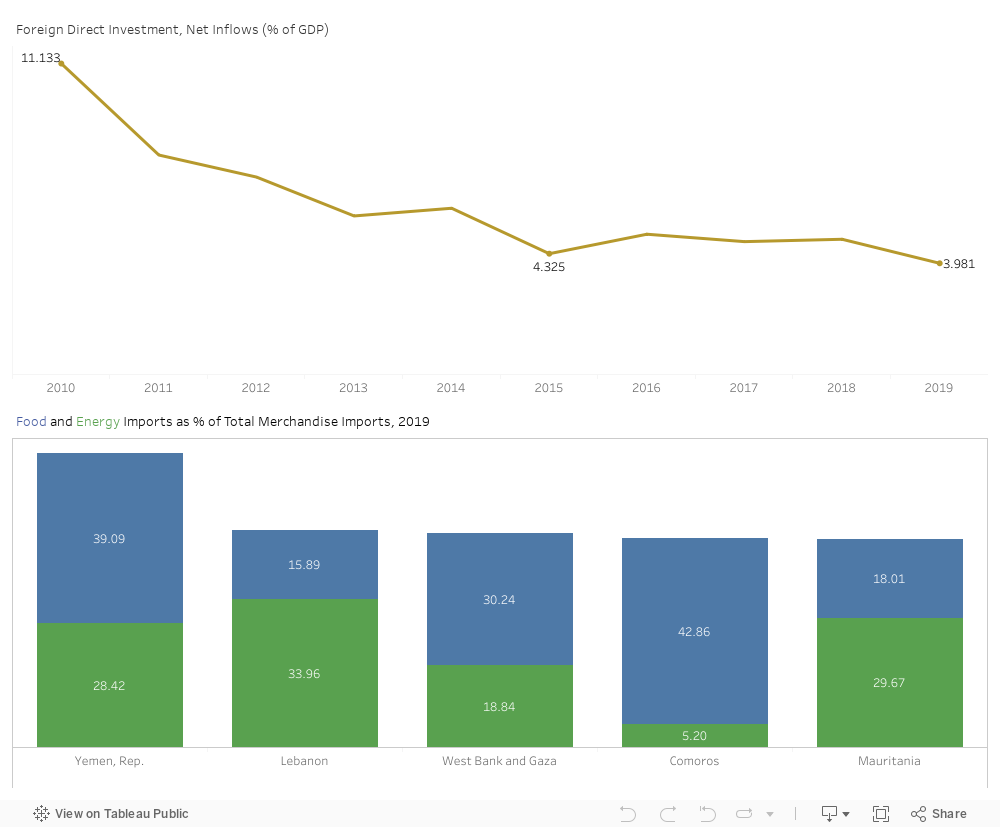
• The decrease of Foreign Direct Investment (FDI) which reached 3.98 percentage points in 2019 due to the lack of security and political tension
• Another possible cause is the low diversification in economic sectors due to scarcity of resources. Looking at this visual, we can see the focus of employment shift mainly to the service industry which witnessed an increase by 65.10 percentage points while the agricultural and industrial sectors are left behind increasing by under 30 percentage points in 2019.
• The third and final possible cause is the over-dependence on food and fuel imports. Lebanon possesses the second highest food and energy imports in 2019.
What should be done?
Drawing upon decades of empirical literature on drivers and predictors of lack of growth, this project proves Okun’s law using visualizations for the case of Lebanon. According to International Labor Organization (ILO), not just growth, but quality of growth is the key anchor in the SDGs 2030 agenda. Sustainable economic growth will require societies to create the conditions that allow people to have quality jobs that stimulate the economy while not harming the environment.
1. Creating greater opportunities for women and men to secure decent employment and income. Closing the employment gap is at the heart of the decent work agenda, this can be through promoting voluntary private initiatives and corporate social responsibility.
2. Instating policies to enhance knowledge, skills and employability for men and women since gender remains a source of labor market inequalities and inadequately utilized human resources. Women continue to be employed in a narrower range of occupations than men and to be concentrated in lower-paid, insecure, and unprotected jobs.
3. Promoting employment through reconstruction and employment-intensive investment.
4. Increasing access to financial services to manage incomes, accumulate assets and make productive investments.
Findings and Recommendations
A shift in economic thinking and planning towards economic structural transformation is necessary for the Arab region to develop on SDG 8 (ESCWA, 2021). The post-pandemic SDG agenda must leverage the lessons learnt to reinforce national social safety nets and employment policies. This strengthens economic resilience and allows developing countries to absorb shocks. A continued lack of decent job opportunities, insufficient investments, and under-consumption slows down economic growth. The average growth rate GDP is increasing after the pandemic; however, it still did not reach pre-pandemic levels of growth and developing countries such as Lebanon are moving farther from the 7% growth rate set for 2030. Therefore, as labor productivity decreases driven by low productivity and unemployment rate rises, standards of living decreases and overall economic growth decreases.
Governments must join forces and formulate policies to promote better job opportunities through active labor market programs, corresponding to important SDGs: Economic Growth and Decent Work, as well as Partnerships to Achieve the Goals.
Sustainable economic growth will require societies to create the conditions that allow people to have quality jobs that stimulate the economy while not harming the environment. Job opportunities and decent working conditions are also required for the whole working age population. There needs to be increased access to financial services to manage incomes, accumulate assets and make productive investments. Increased commitments to trade, banking and agriculture infrastructure will also help increase productivity and reduce unemployment levels in the world’s most vulnerable regions.#SDG8 #SDG16
Global warming is a critical problem facing our planet today causing us natural disasters, diseases and deaths in the present and potential destruction of the planet in the future.
Problem Evidence:
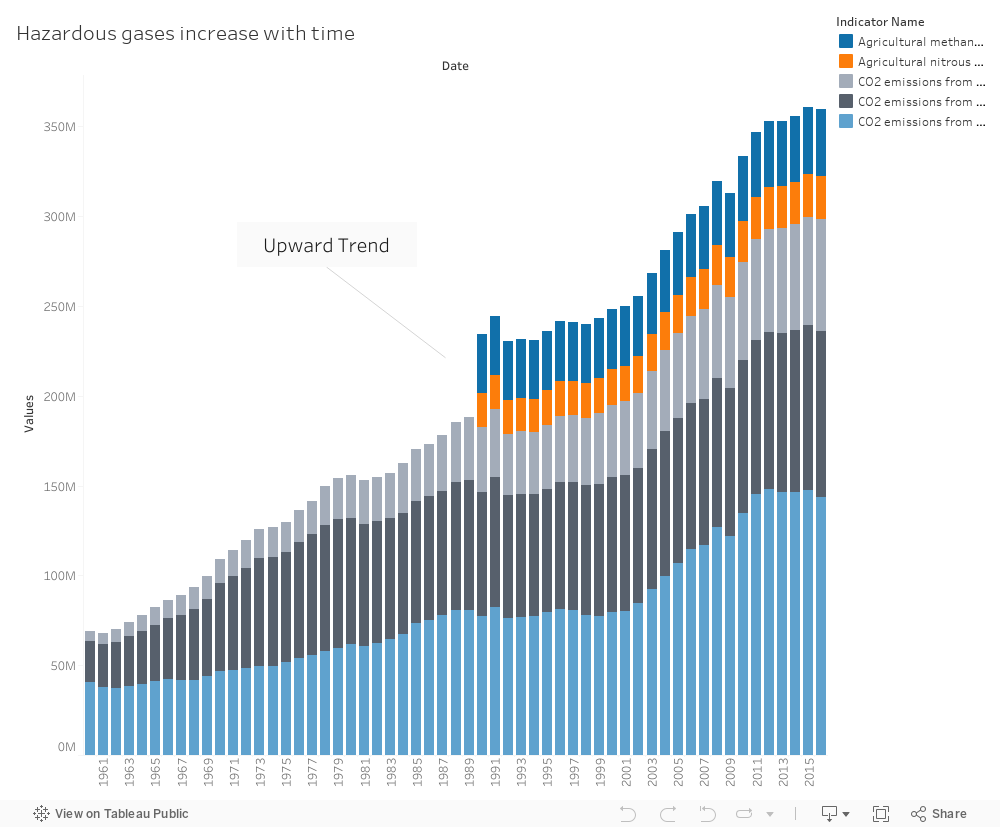
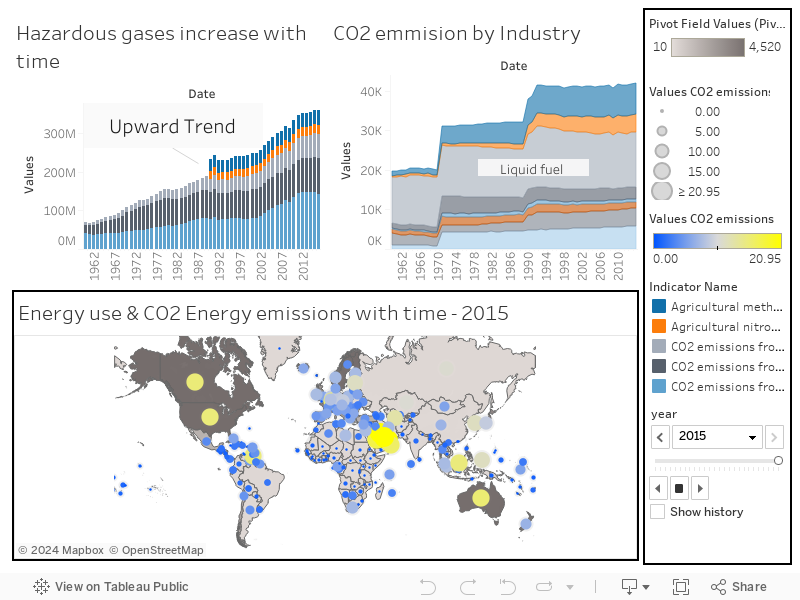
Indicators show global warming is intensifying
After studying different parameters, we can clearly see that everything that causes global warming is in an upward trend and just increasing with time. Toxic gases such as CO2, greenhouse gases and other hazardous materials are increasing in intensity.
This results in complicating the global warming issue more and more with no serious actions taken into consideration.
Looking for solutions:
Working on reducing global warming’s main causes
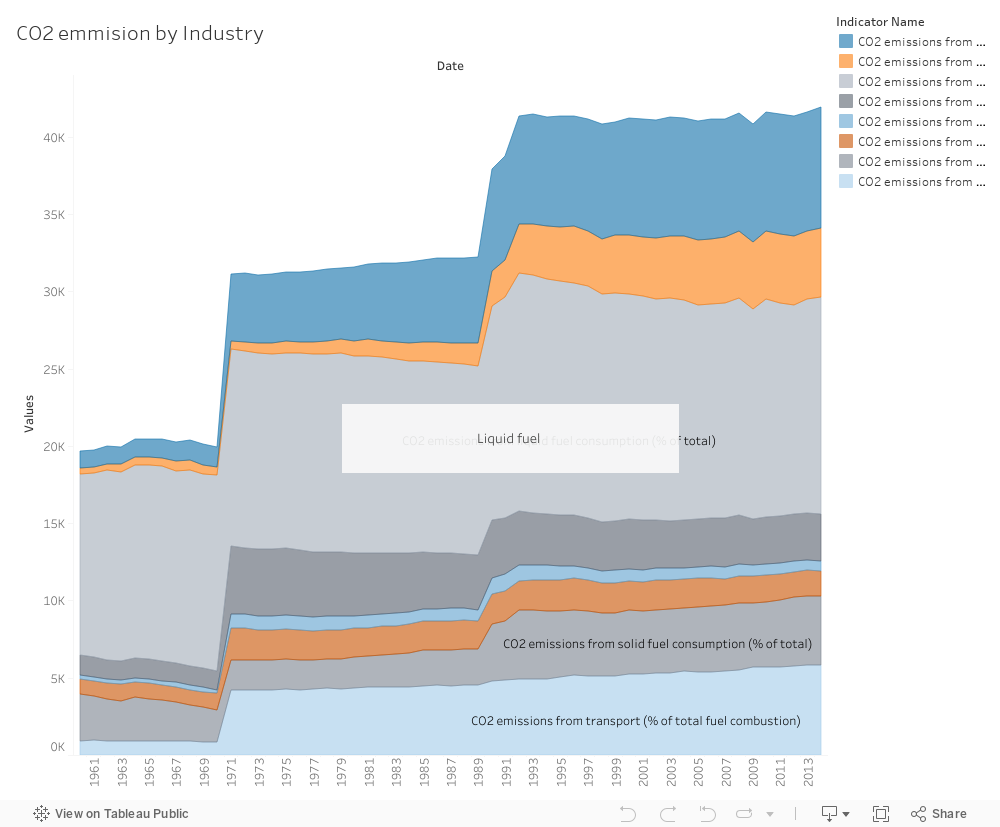
After studying the different industries that produce the main polluting gases, we could then point our fingers at what industry causes the most damage to our planet.
Therefore, after dissecting the problem we could start taking actions focusing on the most harmful industries.
Solution Details:
Setting regulations on main causes
Using the data infront of us we could say that liquid fuel which is mainly used in energy sectors is the greatest cause of CO2 emissions, followed by emissions from electricity and heat production.
Knowing that we should definitely start investing more in green energy instead of liquid fuel consumption and also setting new regulations to organize these sectors.
Solution Validation:
Decreasing pollution as a result
Taking such actions will result in decreasing the harm caused by these gases and chemicals.
Controlling the industries is thus attained and will have a great impact for the future of the planet.
Recommendations:
Better future for the planet!
True colour satellite image of the Earth showing Asia, half in shadow, with cloud coverage, and the sun. This image in orthographic projection was compiled from data acquired by LANDSAT 5 & 7 satellites., Globe Showing Asia, True Colour Satellite Image (Photo by Planet Observer/Universal Images Group via Getty Images)
As a result of the set regulations and switch to more sustainable energy our planet would witness less diseases and pollution in the near future. Also the planet would be preserved for the long run.