
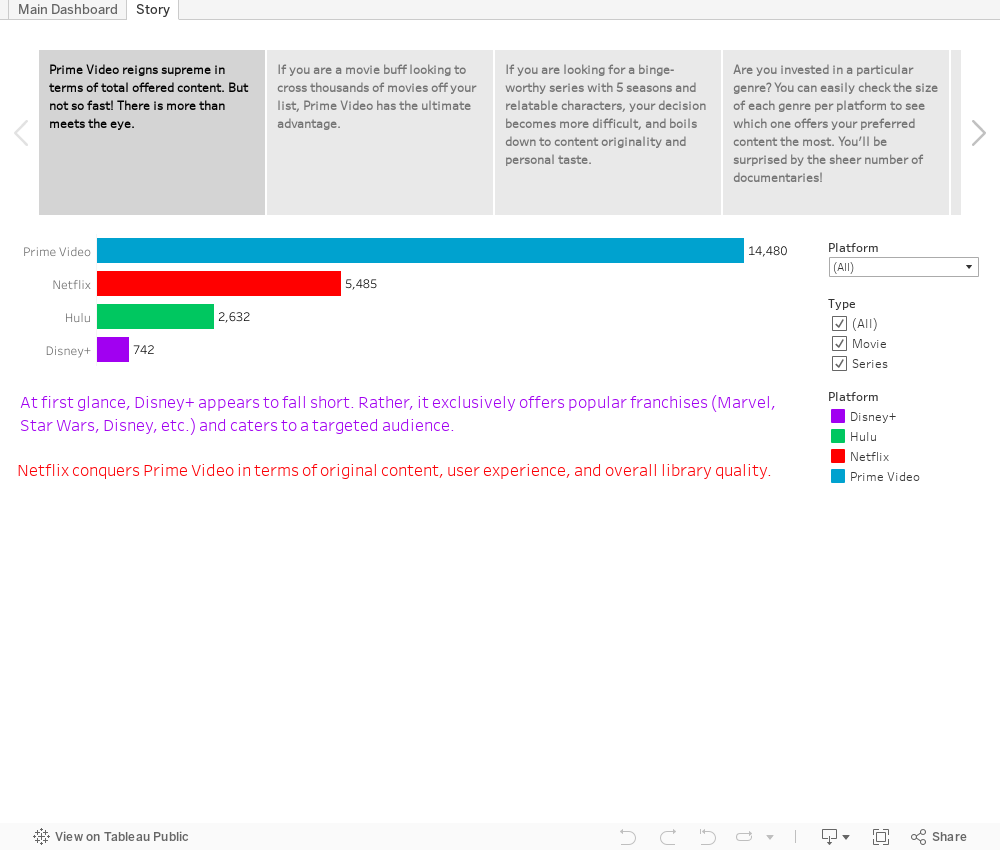
The cord-cutting phenomenon is quickly gaining traction with the advent of COVID-19. Apart from its bothersome commercials and restricted programming, cable TV demands a taxing average rate of $100 per month from its subscribers (CNET, 2019). While more than 31.2 million households have abandoned classic cable in 2020 (TechCrunch, 2020), streaming services have witnessed soaring sign-up rates thanks to their affordable pricing, diverse offerings, and flexible on-demand schemes. For example, Netflix alone received 16 million new subscribers in merely the first quarter of the same year (BBC, 2020).
Yet, as with many cases of consumerism, people might feel overwhelmed by the abundance of choices (American Psychological Association, 2004), and it might be difficult to make informed decisions. Put simply, how may consumers select the appropriate streaming service(s) when more than 100 of them are at their disposal? (CNET, 2019). To mitigate the risk of “streaming service overload” (CNET, 2019), whereby individuals misguidedly drive up their costs by subscribing to numerous services, our team is interested to explore, compare, and contrast the offerings of popular streaming services (Netflix, Hulu, Disney+, and Amazon Prime).
0 Comments