Authors: Tala Abdul Samad, Nour Al Bidewe, Basman Hariri, Sara Sadaka, Aziz Saliby, Jean-Pierre Sakr
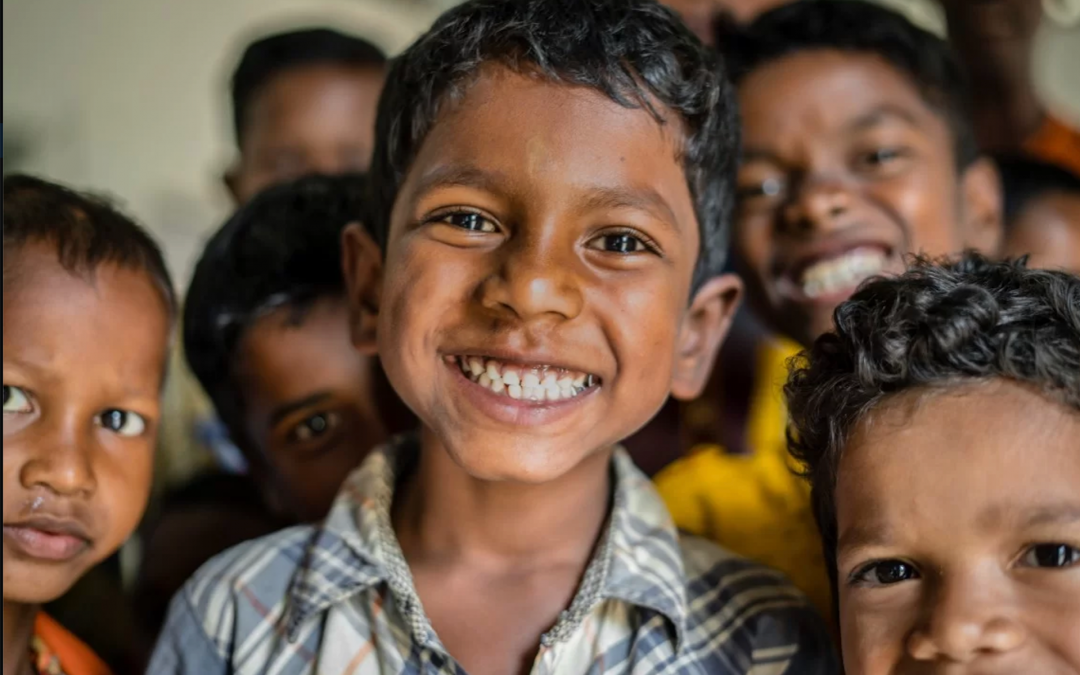
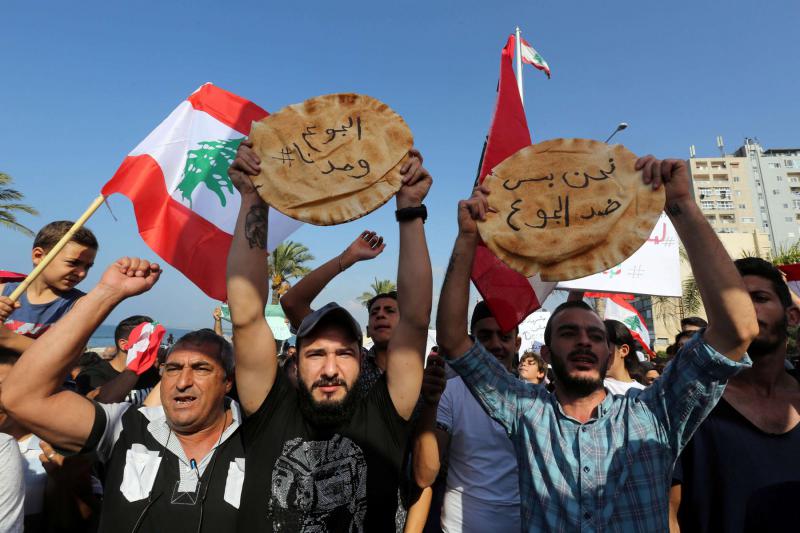
Over the past two years, Lebanon has been witnessing compounded crises such as brain drain, poverty, unemployment, and inequality. On October 3rd, we wanted to listen to the factors that affected the Lebanese the most. Borhan, a 60-year-old man living in Beirut, was one of the people we met. We captured a video with him to show the suffering of the Lebanese since the start of the crisis where he comprehensively described the severe living conditions. As we all know, 2019 was a year of transformation for Lebanon, beginning with the October 17th revolution in 2019, following the global pandemic in 2020, and the rise of inflation. Borhan expressed the feelings of most Lebanese, where he identified the problems that we are facing as residents. Many people mentioned that specific sectors have been hit the most, therefore we would like to perform exploratory data analysis and surveys using different datasets to be able to identify inequalities. We are also interested in using a data-driven approach to identify gaps and inequalities that exist in the education, income, and health sectors.
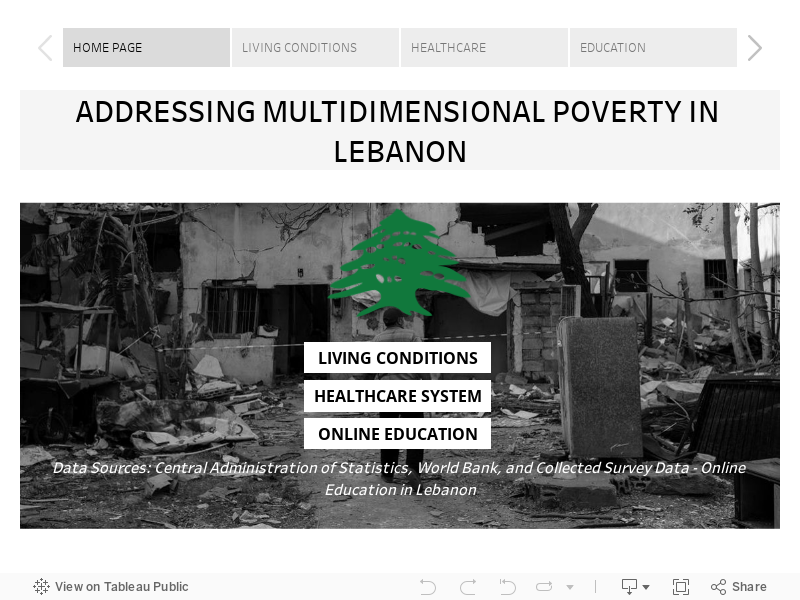
As a result, we have exploited the World Bank’s World Development Indicatorsand we have identified several indicators which we have used as proxies to measure multidimensional poverty in Lebanon. We chose to have a topic related to the multidimensional poverty index in Lebanon compared to the Arab region. Since the multidimensional poverty index is calculated using three different dimensions, namely education, living conditions, and health, we decided to divide the three different dimensions among us.
Living Conditions:
Housing is a significant indicator of the multidimensional poverty (MDP), and based on ESCWA calculations, the main indicators to assume whether housing is counted as depreciation for a household or not are ‘Overcrowding rate’ – the percentage of the population living in an overcrowded household – ‘Housing type’ i.e. houses, apartments, row houses, townhouses and duplexes, ‘Sanitation quality’ – availability of handwashing facilities, toilet cleanliness.
Historical data related to housing utilities in Lebanon was gathered from theCentral Administration of Statistics (CAS), which contains significant indicators to measure MDP such as water, electricity, gas, actual rent, furnishings, household equipment and routine household, and others. Data is shown monthly from December 2007 till September 2022.
This data reported many indicators highlighting the increase in poverty on multiple sides. It is worth reporting that the consumer price index (CPI) Housing Utilities in Lebanon records the highest score this September 2022 (363.3) compared to October 2021 (215.9).
Looking at the nutrition level, food inflation was detected as the cost is more skewed to the right for the year 2021-2022; rising food prices reduce the purchasing power of food consumers. Another devaluation could be mentioned in the transportation sector, as the transportation sub-index of the CPI basket in Lebanon increased by 2339 points in September of 2022 (3,725), compared to August 2021 (1,386); the cost of transportation is significantly increasing, resulting in a limitation to access in the transportation sector.
It is worth mentioning that the CPI in Lebanon has more than doubled over the past year, peaking this September 2022 at a score of 1,611.4 against 714.8 in October 2021, and a higher CPI indicates higher inflation. This eventually leads to adjustments in the cost of living and income, which tends to worsen inequality or poverty as it hits income and savings harder for poorer or middle-income households than for wealthy households.
Healthcare System:
As stated by Joao Martins, MSF Head of Mission in Lebanon, “The crisis in Lebanon has been driven by years of corruption and now we are seeing that this can contribute to the destruction of an entire health system just as effectively as war or a natural disaster”. As a result, it is important to conduct a deep dive analysis on the healthcare system in Lebanon which is a dimension that measures multidimensional poverty.
First we will look at the current health expenditure (%of GDP) which takes into account the public and private health expenditure. By comparing Lebanon to the Arab World, we can notice that the current health expenditure is higher along the mid 2000 with Lebanon having 11% in 2000 while the Arab World having 4%. After that, Lebanon witnessed a decrease and the Arab World an increase reaching a value of 9% and 5%, respectively. The decrease in the expenditure in Lebanon has negatively affected the healthcare system as medication and vaccines are becoming scarce. Looking more closely, we can see in the next graph that the access to immunization has tremendously decreased in Lebanon. On average the access to vaccines (such as DPT, HepB3, and measles) has decreased from 83% (2000) to 67% (2021).
On another hand, we evaluated the demand for private insurance in Lebanon. As we can see, the demand has decreased from 70% (2000) to 45% (2021). This decrease is due to all private insurance companies converting their payment method to fresh U.S. dollars and since the NSSF benefits have diminished due to the economic crisis, most Lebanese people are now left with no proper access to health assistance.
Education:
We also conducted a survey on school and university students to analyze access to online education during the COVID-19 pandemic which was also identified as the new normal.
You can be part of our project by filling this online survey. Your answers are highly valuable to the development of our dashboard since the larger the sample size, the more accurate our results would be.
At a later stage, we would like to present our results to our target audience which are UN agencies, local NGOs, and Lebanese ministries. We got a total of 135 responses from all over Lebanon where the survey was populated via social media platforms. The majority of the respondents were university students or graduates. Most of them were unemployed or employed in a full time position.
We asked the respondents about their evaluation to their online experience; the answers rated their experience as poor or fair. On a scale from 1 being a very bad experience and 5 being a very good experience, most of the respondents rated the effectiveness of online learning as 3. In addition, we asked about the preferred type of education; the majority answered the traditional physical method as the most preferred following the hybrid method as second preferred. These answers make us conclude that the online learning experience was not that good in Lebanon. This might be due to the lack of training from the government and the teachers.
To further explore the facilities that were available to ease the online learning experience, we asked the people about their access to devices, electricity and internet. For the devices, the majority had access to devices that were mainly Mobile phones or laptops. Most of the respondents have access to electricity but not all the time while almost all the respondents have access to internet but the variance changed between access all the time and access but not all the time. Most of the respondents reflected that they couldn’t focus and they weren’t serious about their studies during online learning. Furthermore, on a scale from 1 being not at all to 5 being for sure, we asked the people about their willingness to retake the online experience. The answers varied between 1 and 2 mainly.
Finally, we asked the people about the disadvantages of online learning. Some of the responses include poor network, electricity cuttage, procrastination, weak communication, lack of motivation to study, more distraction, professors are not equipped with the resources, challenging experience for both students and professors. From this survey, we can conclude that Lebanon wasn’t prepared well for such a situation, especially its basic infrastructure which includes bad electricity and network services.
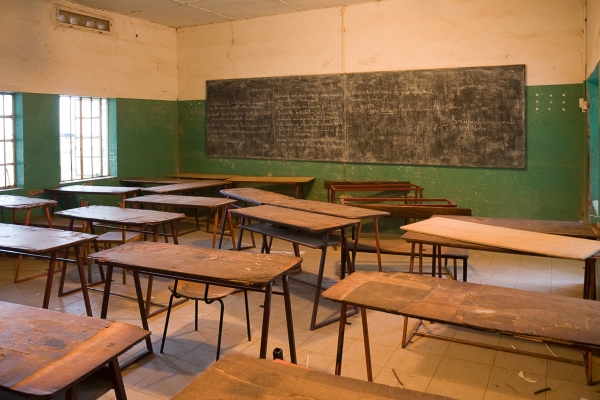
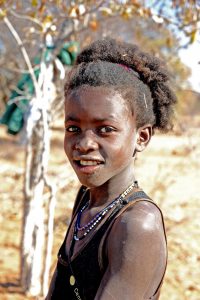
“When children must split their time between fetching water and protecting their families’ greatest wealth, the livestock, their education suffers” Marco Prates
Marta Ndimaoshitya
Meet Marta Ndimaoshitya:
Marta is a 12-year-old educated girl. “Educated?”, You might say. “Then what’s the problem?”, you might wonder. Well, the problem isn’t with Marta, it’s with Marta’s 3 siblings who have dropped out of school because there is no water for them to undertake the long walk to reach the school. The only reason Marta is able to go to school is that it is close to her home. You might have thought of many reasons why they are unable to receive proper education, but I doubt this one would have crossed your mind. Unfortunately, many children around the world live a life similar to Marta’s siblings and even worse.
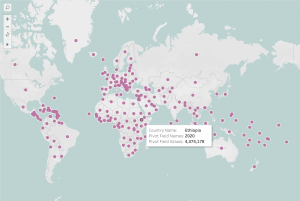
The below visualization will offer a clear sight of the countries that are suffering from children being out of school the most. I wish to shed light on these countries as the aim is not just to know the number of school dropouts, it is also to help solve the major factors that render this behind each specific country.
Countries like Libya, Nigeria, Chad, Ghana, and many more experience very high numbers of children out of school. Some of the factors that render this are poverty, gender inequality, child marriage, lack of access to clean water, and armed conflict.
Recommendations:
Raise awareness on the importance of education
Provide financial support for poor families
Provide flexible, affordable, high-quality school options
A pandemic that is targeting the under-privilege, as if the right of living and being protected from such a disease is dependent on one’s status and unfortunate living conditions.
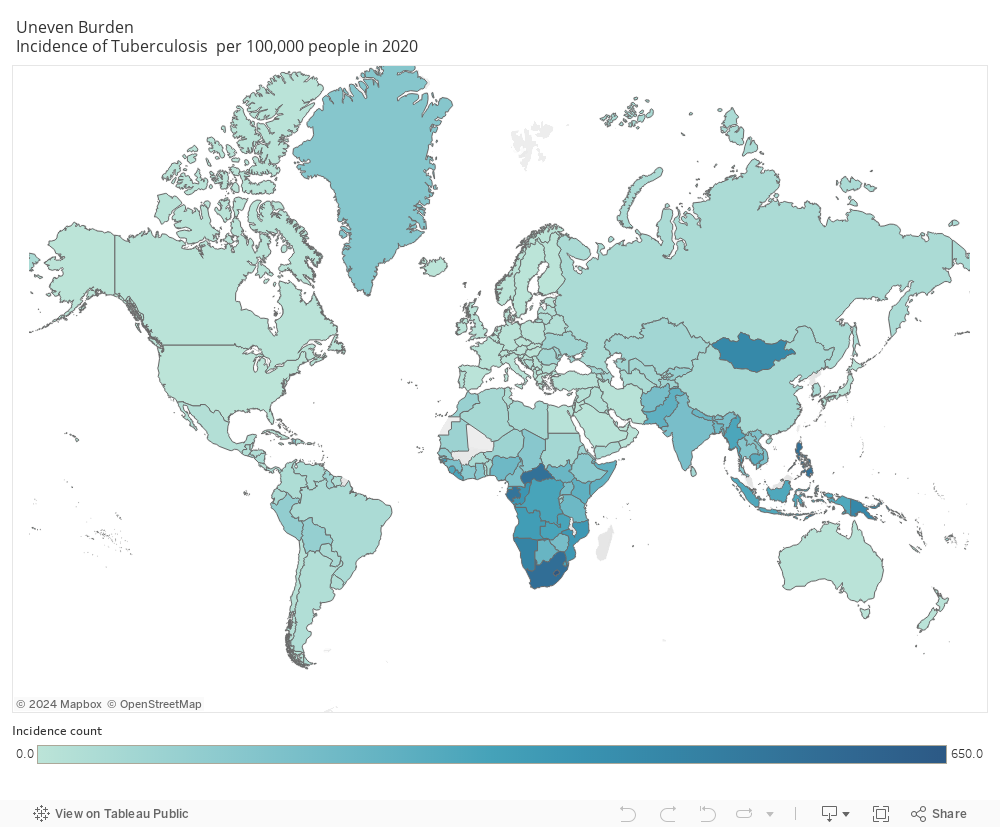
Tuberculosis continues to be a huge peril disease against the human population and according to WHO, TB is the leading cause of death in infectious diseases killing over 1.5 million people around the world in 2020 alone, 95% of which is occurring in developing country.
The below is a reflection of the data from the world data index showing the uneven distribution of TB incidence per 100,000 in 2020 that is occurring. A steady decrease in developed countries , however a remaining major problem in developing countries.
The World Health Organization (WHO), following the guidelines of the United Nations’ Sustainable Development Goals (SDGs), plans to eradicate the pandemic by the year 2030. The goal is to reach a 90% reduction rate in the number of deaths due to TB by the year 2030, and 95% by 2035.
Actions to be taken:
Allocate funding on providing chemoprophylaxis (the number one treatment for TB) to developing countries to increase access for the underprivilege and decrease spreading of TB.
Adjust healthcare policies and increase campaigns for free BCG vaccination in developing countries , making it mandatory as with many developed countries
Mass screening tests to detect dormant or active TB, to decrease spread especially with over-populated settings and among the immunosuppressants.
Increase Awareness campaigns to educate the population on the signs and symptoms and importance of preventive measures to be taken for a better chance of survival.
The key to an end of the pandemic starts with you!
I am a healthcare worker and I urge you after this blog to do the following:
Check your vaccination history on BCG, along with your family.
Educate your self with the signs and symptoms: persistent cough with bloody secretions , severe chest pain and shortness of breath , weight loss and generalized weakness , fever and night sweats
Tuberculosis may be dormant, meaning asymptomatic for years for that if you have never been tested, urgent medical screening is required.
If you experience any of the signs and symptoms , seek immediate medical help
Keep your distance when engaging in a conversation and avoid crowded places!
FROM “Man up, you can’t be depressed just because this happened!” TO “Why are you looking so sad and tired? Are you depressed? You can talk to me if you want..”
To begin with, according to the World Bank dataset on development indicators, it is clear that men’s average suicide mortality rate is significantly higher than females.
Surprisingly, males are three times more suicidal than females, reaching an average of 14.3 male suicides per 100,000 males, while 4.4 female suicides per 100,000 females.
But why is this the case?
While comparing countries with high unemployment rates and countries with low unemployment rates, the following analyses were investigated:
To begin with, in Countries with highest unemployment rates, the suicide mortality rates for both men and women are higher.
However, when faced with difficult economic situations:
Females suicide mortality rates were higher by 150%
Males suicide mortality rates were higher by 217%
This leads to the conclusion that men’s mental health tends to be more susceptible to financial burdens.
So, what should be done?
A potential solution would be providing unemployment benefits, which are governmental compensations that are provided for unemployed people. These compensations help secure a stable income after the layoff of an employee, and they improve unemployed people’s productivity in the labor market by improving job matching and connecting employees to employers.
In addition, this solution can be helpful in mitigating the impact of unemployment on the psychological wellbeing of people.
As the following illustration shows, both females’ and males’ suicide mortality rates are higher in countries with loweradequacy and coverage of unemployment benefits
More specifically, males’ suicide rates are 31% lower in countries with high adequacy and coverage of unemployment benefits.
Thus, in order to mitigate the males’ suicide mortality, several recommendations are suggested to be effective.
First, it is highly recommended that suicide prevention groups intensify their focus on men and encourage them to express themselves and seek psychological help.
Equally important, in countries with high unemployment rates, governments should work on providing unemployment benefits and ensure their wide coverage of the unemployed.
You’ve probably heard about all the advancements that the world has witnessed in the past decades, be it on technological breakthroughs, social rights or positive movements towards a sustainable society. You heard leaders from all around the globe preaching these achievements, promising the current generation “a better future for their kids”. But have you ever paused for a second and thought about these last few words? “Better future for their kids”. You pause for a second and look around, to just realize that this world that we are trying to improve for the future generations, has already condemned part of that generation – and their only fault is that they are kids. This post specifically targets child labor – a crime which, to date, has not yet been abolished. What is child labor exactly? The International Labor Organization (ILO) defines child labor as any activity that physically, mentally and/or morally abuses children, depriving them from their right to own their childhood. We’ve seen that despite some positive developments towards the beginning of the decade, the average number of hours worked by children aged 7-14 have spiked again towards the later years. This is true for both working only, and working & studying children. There is also no difference on the gender levels – both females and males have seen an increase in the average number of hours worked in recent years. Looking more granularly at the country distribution, we can spot that, indeed, a lot of positive development has happened across the world. But positive development is unfortunately not enough, when there is still one child out there deprived from his/her childhood. To be able to gain a better insight into what drives child labor, we look at a country-level comparison, where we contrast mature markets with almost nil child labor levels to countries in a more developing stage. As a case study, we look at Turkey and Egypt (both with huge populations and large economies) vs. France, Germany and the UK. The first metric we look at is women employment; indeed, in the countries where women’s participation to the labor force is higher, child labor is lower. Second, we look at birth rates: in the countries where birth rates were much higher, child labor was definitely more prevalent. Makes sense, no? The higher the number of mouths to feed, the higher the income needed! We also look at the levels healthcare spending in these countries – needless to say, the charts speak for themselves. Child labor is directly related to the household’s overall financial and well-being state. In countries where healthcare is expensive, unreliable or simply unattainable, the likelihood for falling sick is higher, putting the responsibility of feeding a household on the youngsters of the latter.We strive for a better world for the next generation, while completely ignoring the current one. How can we build a better future for children, if we are building it on the backs of children?


 While comparing countries with high unemployment rates and countries with low unemployment rates, the following analyses were investigated: