
The Resource Curse: Pitfalls and Reforms
What is the Resource Curse?
While one might expect to see better development outcomes after countries discover natural resources, resource-rich countries tend to have higher rates of conflict and authoritarianism, and lower rates of economic stability and economic growth, compared to their non-resource-rich neighbors. This is what has become known as the Resource Curse. Countries like Venezuela in Latin America, Angola in Africa, and Saudi Arabia and the United Arab Emirates in the Middle East have all exhibited varying degrees of this problem. Countries suffering from the resource curse also have significantly higher rates of pollution, and those with higher GDP per capita rely less on renewable energy sources. Because those countries are also mostly authoritarian, taxes are not collected from the people and government expenditures are not monitored.
In Lebanon, the prospect of commercial gas fields has excited the people and has led the government to sign contractual agreements with drilling companies to start exploring and producing commercial gas. Many believe that this project would enrich and stabilize Lebanon, but the history of resource-rich countries predicts otherwise.
Problem Evidence
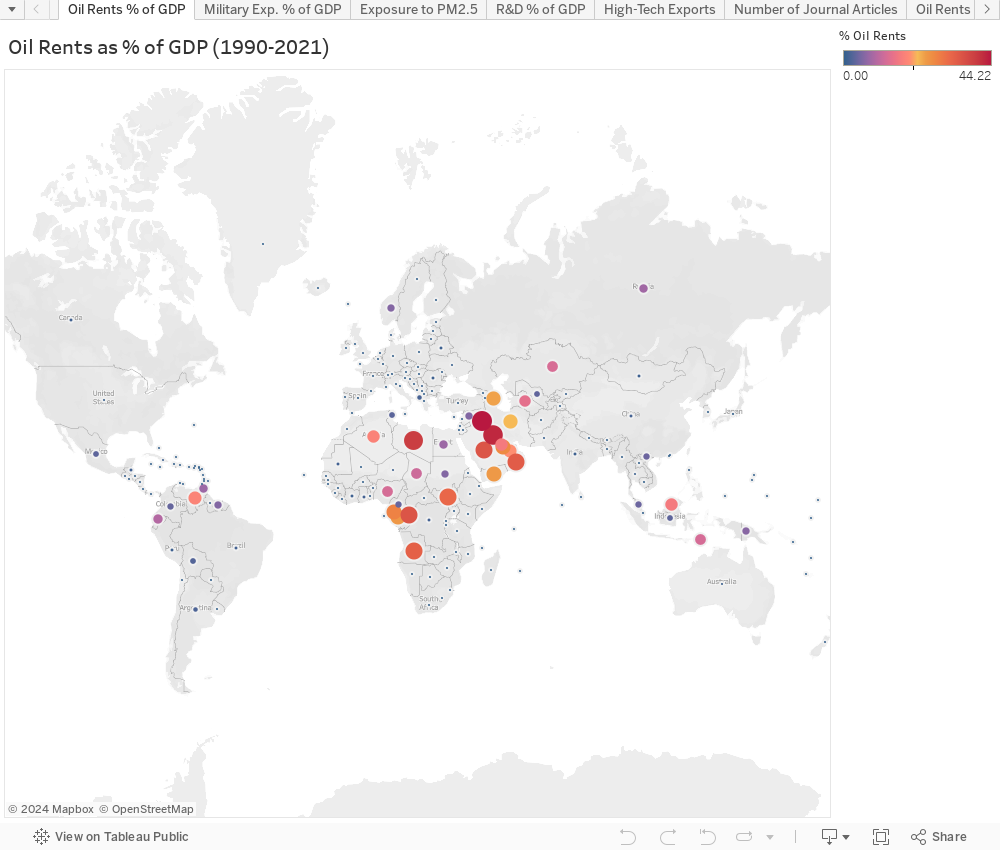
Economic Instability (related to SDG 8, 8.2): Below, we can see each country’s oil rents share of GDP, that is, the share of resource sales and exports out of total GDP. We can clearly observe that Gulf Countries and some resource-rich African countries like Libya, Angola, Democratic Republic of Congo and others, have oil rents account for 25 to 45% of their GDP on average for the past 30 years.
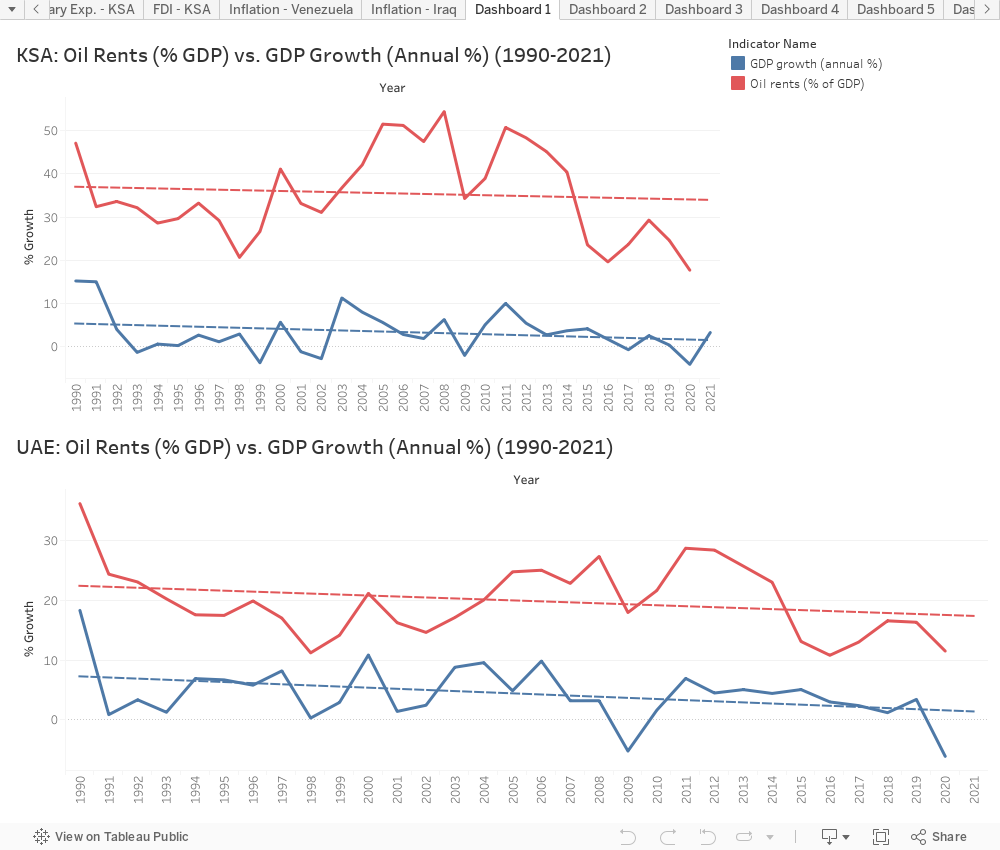
We can also see how Oil Rents move exactly in tandem with GDP Growth for Saudi Arabia and the UAE, which means that their economic growth is highly dependent on oil prices and sales volume, rendering it non-sustainable.
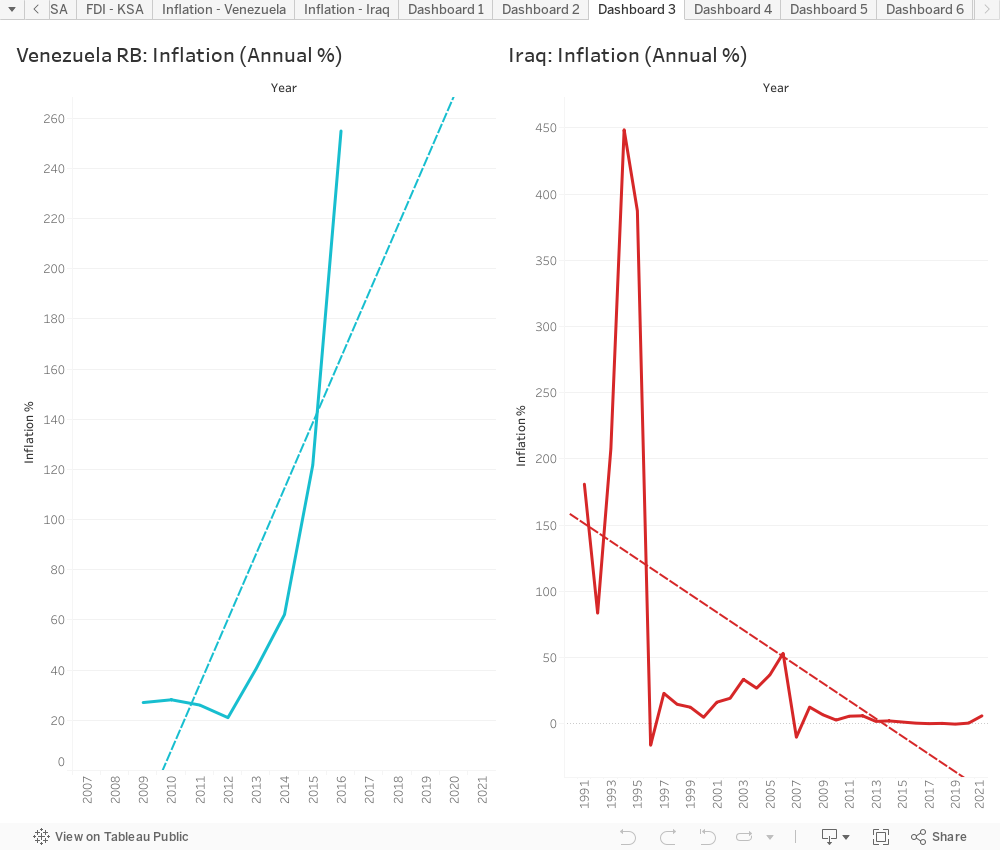
As for economic instability, severe inflationary periods have been recorded for these countries with the Gulf’s Oil Crisis in the 1970s through 1980s and the 1990 Oil Shock which impacted the Arab World greatly, and then Venezuela’s insane inflation rate which since 2016 has increased to 53,798,500%. These trends can be observed below for Saudi Arabia, the UAE, Iraq and Venezuela. The inflation rate is more volatile in these countries and the consumer price indices are in a steep upward trend.

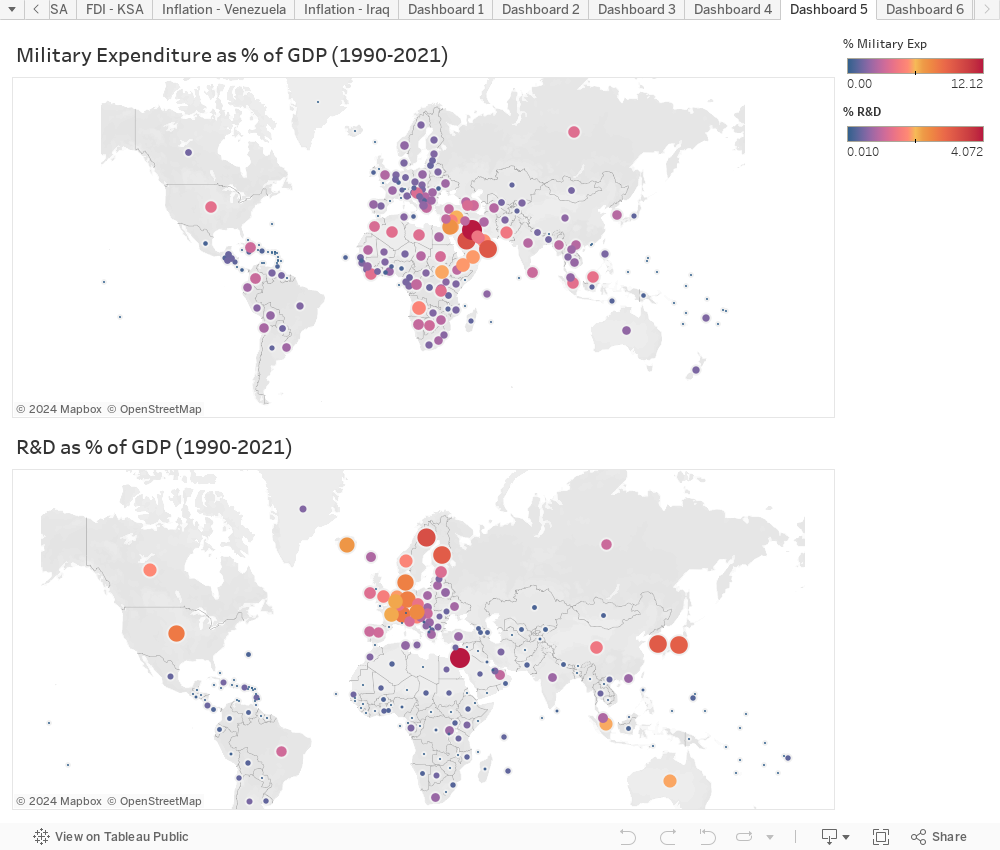
Conflict and Government Expenditures: We can see in the representation below how countries which were perceived to be most reliant on Oil Rents are also more likely to have a higher share of their GDP be dedicated to Military Expenditure (SDG 16, 16.4). This indicates they are more prone to conflict, wars and social instability. Also, the lack of monitoring for governmental expenditures means that important sectors can be de-prioritized. For example, the research and development expenditures’ share of GDP is much lower in Arab countries than in Europe (SDG 9, 9.5, 16, 16.6).
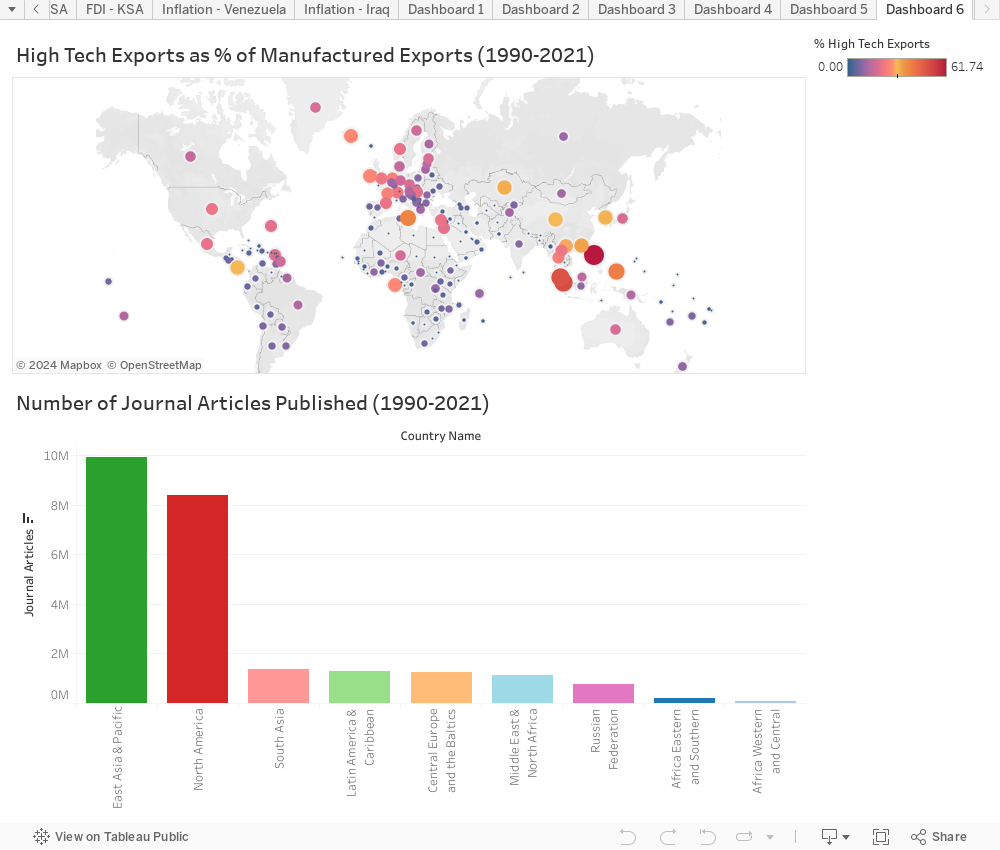
The number of journal articles produced by each area of the world clearly shows the Middle East and Africa’s lower priority for innovation and scientific or scholarly research. High technology exports also have a low share of GDP in comparison with European, North American and East Asian countries.
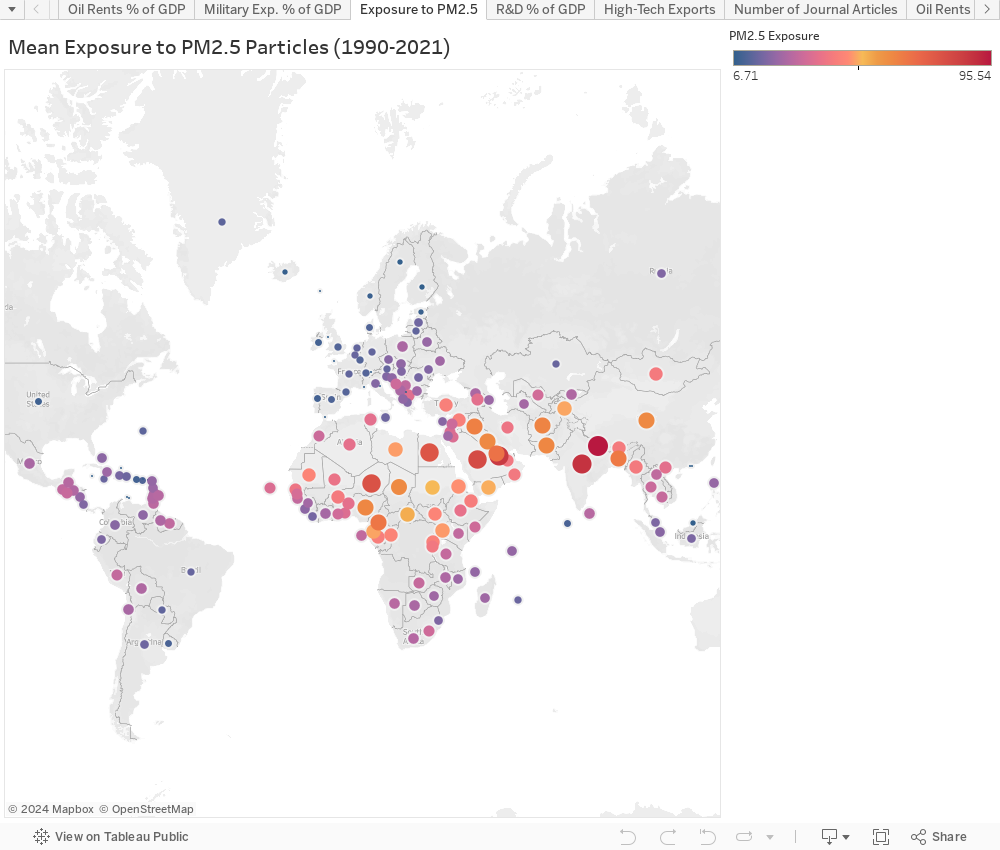
Pollution and Environmental Impact (related to SDGs 3, 7, 7.2, 8, 8.4): The mapchart below clearly shows the high exposure to PM2.5 molecules in resource-rich countries. Despite having lower population rates and less condensed cities, the Gulf Countries are amongst the most air polluted countries. Saudi Arabia uses only oil as an energy source and has a renewable energy sources rate close to 0% (out of total consumption). The UAE also uses only natural gas to power the country and no renewable energy sources.
Solutions and Reforms: Example of Saudi Arabia
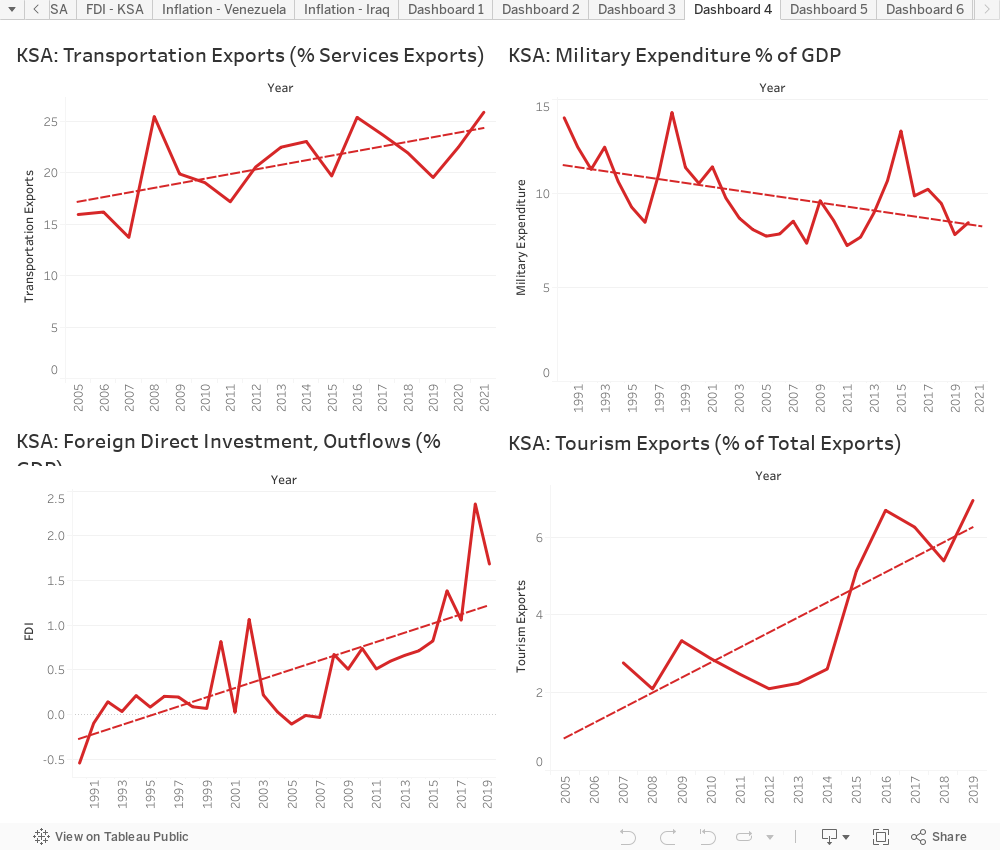
Eventually, Saudi Arabia took serious steps to diversify its economy and to become less reliant on its natural resources. It took counsel with the IMF during the early 2010s and then announced its Vision 2030 which aims for sustainable development and diversification of the economy. The data shows improvements on many levels. First of all, we can see that the GDP’s composition is shifting from being purely reliant on Oil Rents to including more activities done in the Transportation and Tourism (SDG 8, 8.9) sectors. We can also see that more Foreign Direct Investments are being made.The Military expenditures’ share of GDP is also regressing over time.
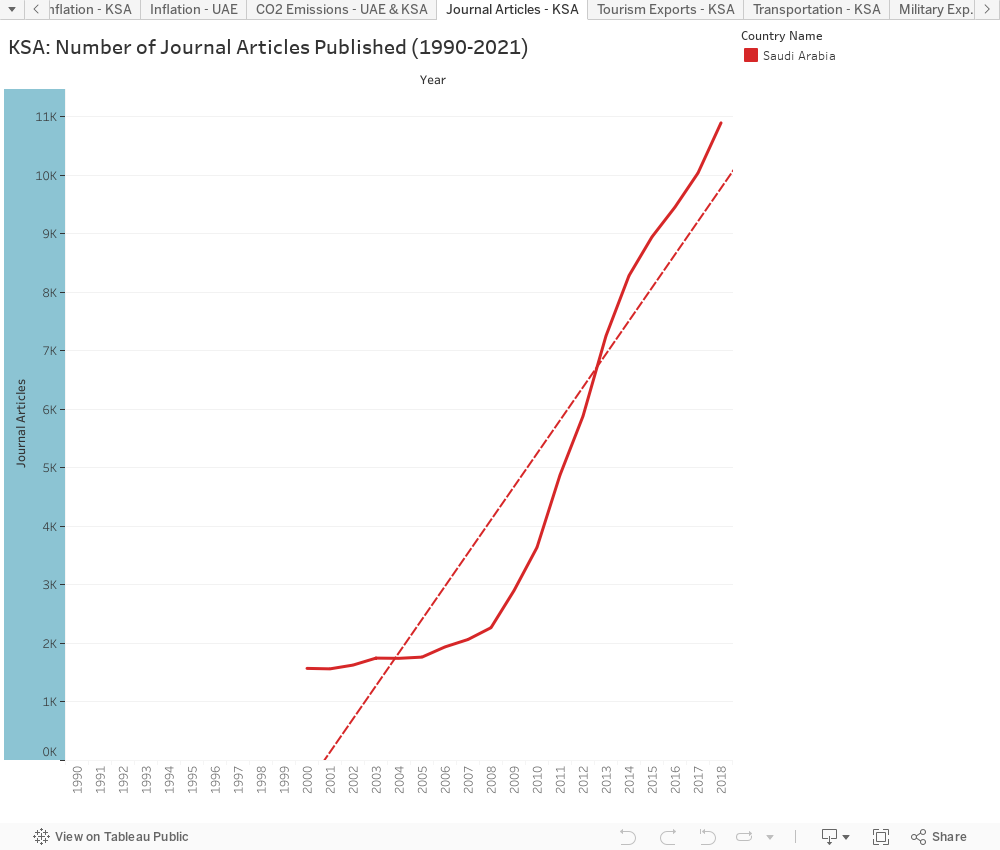
The number of journal articles published is also increasing rapidly with more and more Saudi Arabians focusing on scientific research and on new technologies (SDG 9, 9.5).
Recommendations for Lebanon
It is important to be aware of the consequences that a resource rich country may face by relying on its resource. Lebanon already has weak governance and is prone to economic instability and conflict, this is why it is especially important to learn about the reosurce curse and to keep encouraging the Lebanese people to be productive and to ensure that the governmental institutions are diversifying the economy, maintaining price stability, and producing energy from renewable resources even with natural gas being available as a resource; these concepts are especially relevant to the UN’s sustainable development goals which call for sustainable economic development, good governance, and environmental health. The data shows that proper public policy and budget controls can truly be impactful.

Health Expenditure Per Capita in Different Countries
According to the World Health Organization, global spending on health was rising reaching up to $8.3 trillion in 2018. However, lower income
countries face severe health financing constraints, which slow their progress towards health security and universal health coverage.
With more than 445 million cases, 6 million deaths, and $10.2 trillion in Global healthcare, the Covid-19 pandemic has had a devastating
impact on health systems globally.
Why aren’t lower-income countries financing the healthcare sector efficiently?
Domestic health financing by lower income countries was financed primarily by private sources. The average finance of health sending was
69% by private sources in low-income countries. On the other hand, in upper middle and high income countries, private financing was only
38%.
Visual:
The visual below shows how different countries’ healthcare expenditure per capita (as a percentage of GDP) throughout different years
preceding the pandemic. It indicates that countries with lower GDP, spend less on healthcare.
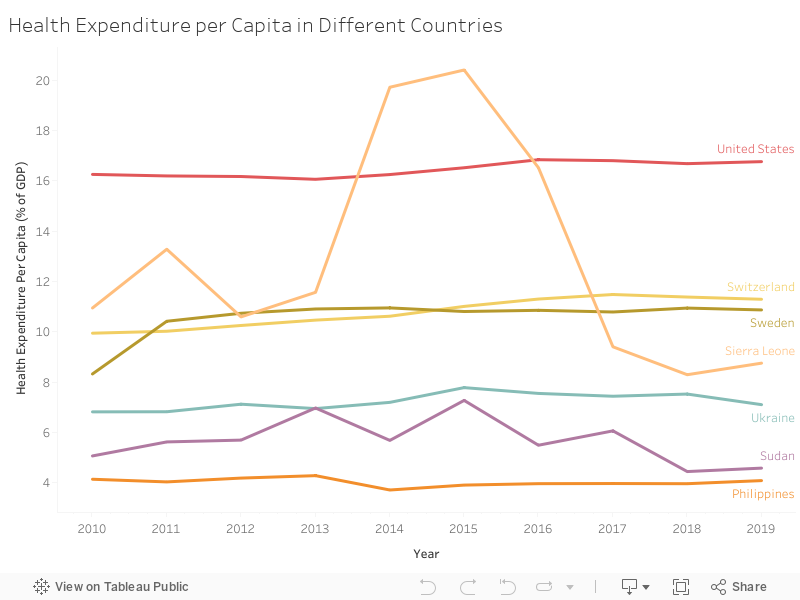
The US has significantly higher healthcare expenditure per capita in comparison to other countries (16% of GDP).
On the other hand, being a low-income country, Pakistan’s healthcare expenditure does not exceed 3% of GDP.
Recommendations:
– International Comparisons to study whether countries with higher expenditures were able to fight the pandemic in a more efficient manner.
– Increase aid in lower-income countries to ensure equal access to healthcare.
– Invest in global common resources for health to enable global health security to fight any future health challenges that arise.

Impact of Education on Suicide Mortality Rate
Suicide is a severe public health problem that affects people all around the world. Every year, 703 000 individuals die by suicide over the world. It is one of the most common causes of death. Suicide kills more people around the world than any other cause (Malaria, HIV/AIDS, breast cancer, and other diseases). Suicide claimed the lives of more than one death in every 100 (1.3 percent) of people in 2019.
The World Health Organization (WHO) has made suicide mortality reduction a global priority and included it as an indicator in the United Nations Sustainable Development Goals (SDGs) under target 3.4, as well as in WHO’s 13th General Program of Work 2019–2023 and the WHO Mental Health Action Plan 2013–2020, which has been extended to 2030. Suicide prevention requires a comprehensive and coordinated response to ensure that the tragedy of suicide does not continue to claim lives and touch millions of people via the death of loved ones or suicide attempts.
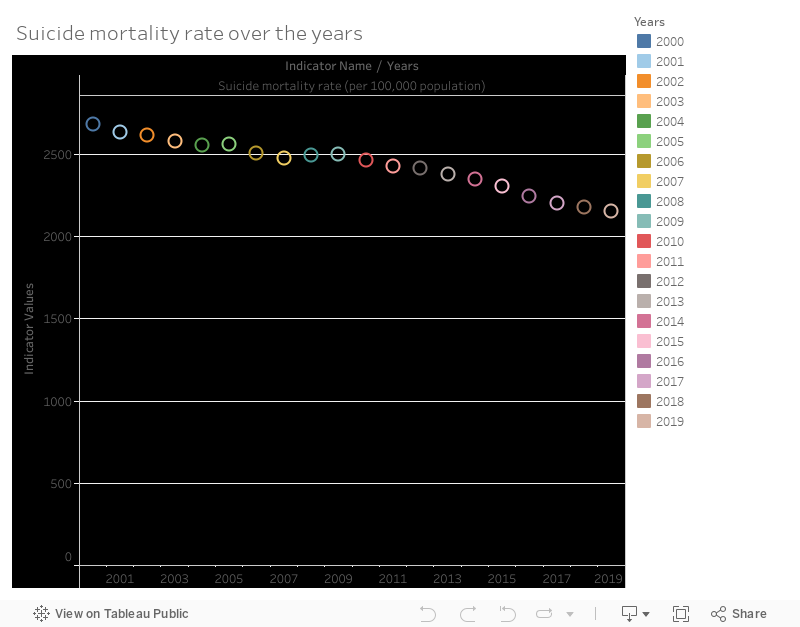
WDI-DATA shows that the suicide mortality rate is decreasing at low rates from 2000 to 2019.
Taking Action!
Action should be taken to reduce the suicide mortality rate worldwide. What if we raised the educational level in each country? Will the suicide mortality rate decrease?
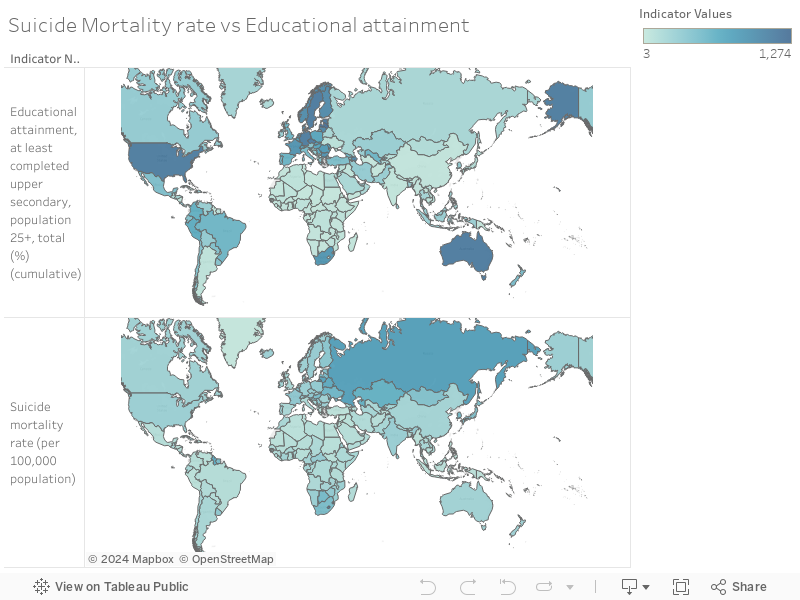
Data from the WDI (World Development Indicators) are used to study the impact of education level on the suicide mortality rate.
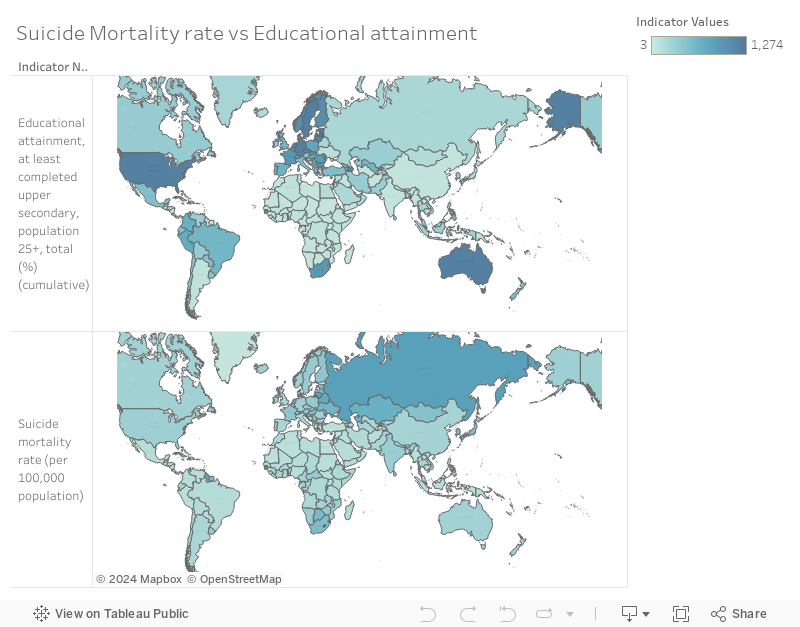
From the visualization, we noticed that the higher the level of educational attainment, the lower the suicide mortality rate, such as in the US and vice versa.
Final Recommendations:
 Data demonstrates the importance of education and its effectiveness in decreasing the suicide mortality rate.
Education assists people in becoming better citizens, obtaining a higher-paying career, and demonstrating the distinction between good and wrong.
That’s why the law of compulsory education should be enforced worldwide.
Tuberculosis – A pandemic for the underprivilege?
A pandemic that is targeting the under-privilege, as if the right of living and being protected from such a disease is dependent on one’s status and unfortunate living conditions.
Tuberculosis continues to be a huge peril disease against the human population and according to WHO, TB is the leading cause of death in infectious diseases killing over 1.5 million people around the world in 2020 alone, 95% of which is occurring in developing country.
The below is a reflection of the data from the world data index showing the uneven distribution of TB incidence per 100,000 in 2020 that is occurring. A steady decrease in developed countries , however a remaining major problem in developing countries.
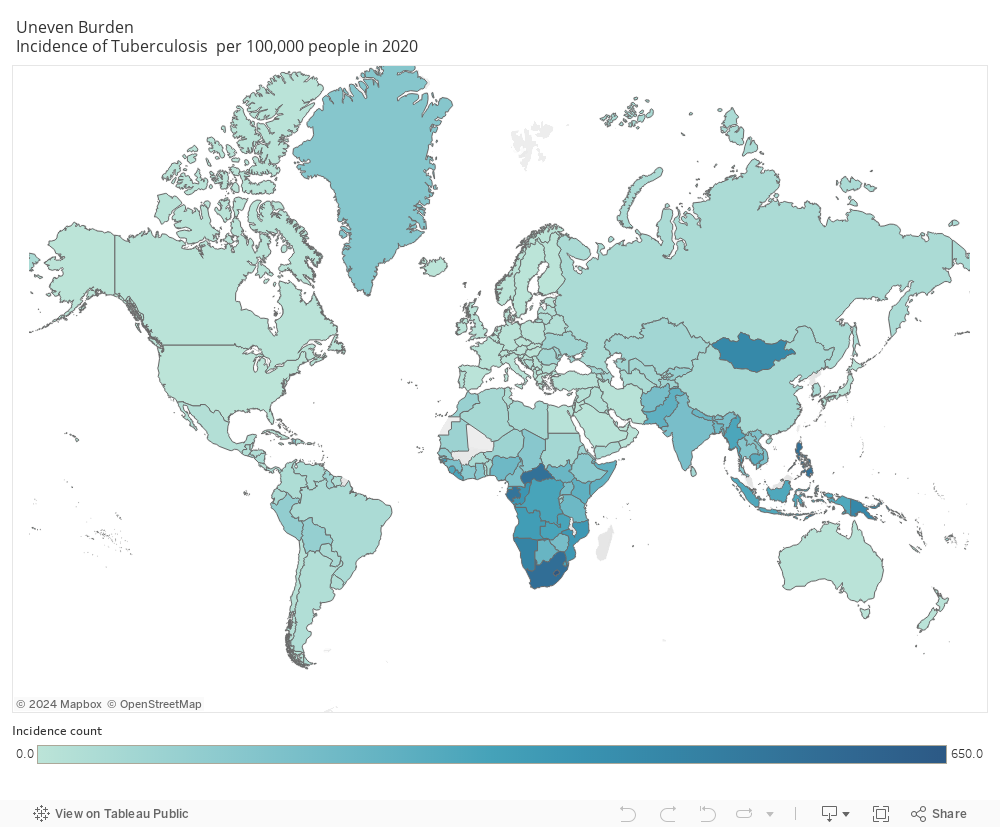
The World Health Organization (WHO), following the guidelines of the United Nations’ Sustainable Development Goals (SDGs), plans to eradicate the pandemic by the year 2030. The goal is to reach a 90% reduction rate in the number of deaths due to TB by the year 2030, and 95% by 2035.
Actions to be taken:
- Allocate funding on providing chemoprophylaxis (the number one treatment for TB) to developing countries to increase access for the underprivilege and decrease spreading of TB.
- Adjust healthcare policies and increase campaigns for free BCG vaccination in developing countries , making it mandatory as with many developed countries
- Mass screening tests to detect dormant or active TB, to decrease spread especially with over-populated settings and among the immunosuppressants.
- Increase Awareness campaigns to educate the population on the signs and symptoms and importance of preventive measures to be taken for a better chance of survival.
The key to an end of the pandemic starts with you!
I am a healthcare worker and I urge you after this blog to do the following:
- Check your vaccination history on BCG, along with your family.
- Educate your self with the signs and symptoms: persistent cough with bloody secretions , severe chest pain and shortness of breath , weight loss and generalized weakness , fever and night sweats
- Tuberculosis may be dormant, meaning asymptomatic for years for that if you have never been tested, urgent medical screening is required.
- If you experience any of the signs and symptoms , seek immediate medical help
- Keep your distance when engaging in a conversation and avoid crowded places!