by szs09 | Nov 22, 2022 | Uncategorized
Water is Wealth – A Call for Action in Africa
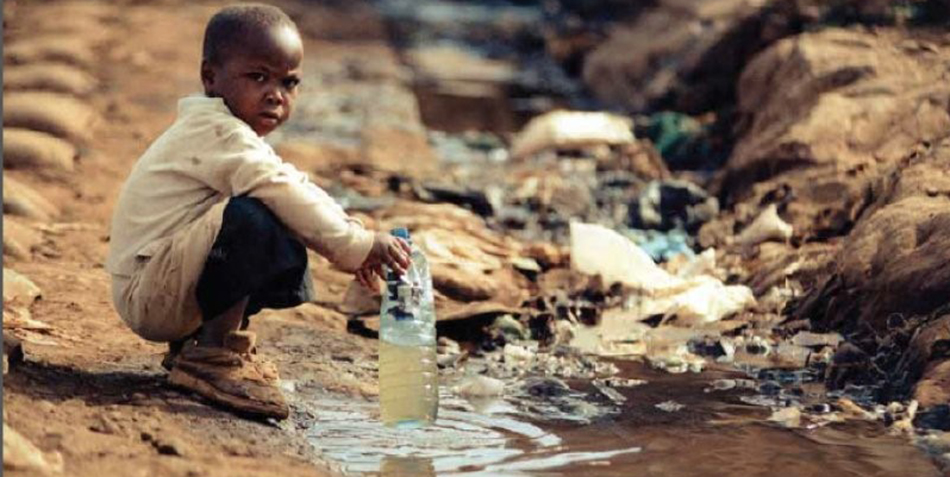
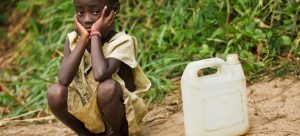
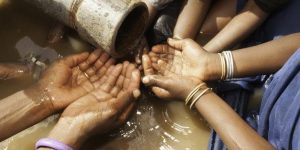
We often tend to forget that the water cycle and the life cycle are one. Millions of women and children spend 3 – 6 hours collecting water from distant polluted sources daily and 2.1 billion people do not have access to clean and safe drinking water. We live in a world where half the hospital beds are employed by patients who suffer from diseases associated with lack of access to clean water where 3.4 million people die each year.
Access to clean water in Africa on Non-Profit Organizations that offer the country a well to be used by every institution that surrounds it. Therefore, “How Can We Make Water Available for All?” is a very important topic that is being addressed through the Sustainable Development Goals.
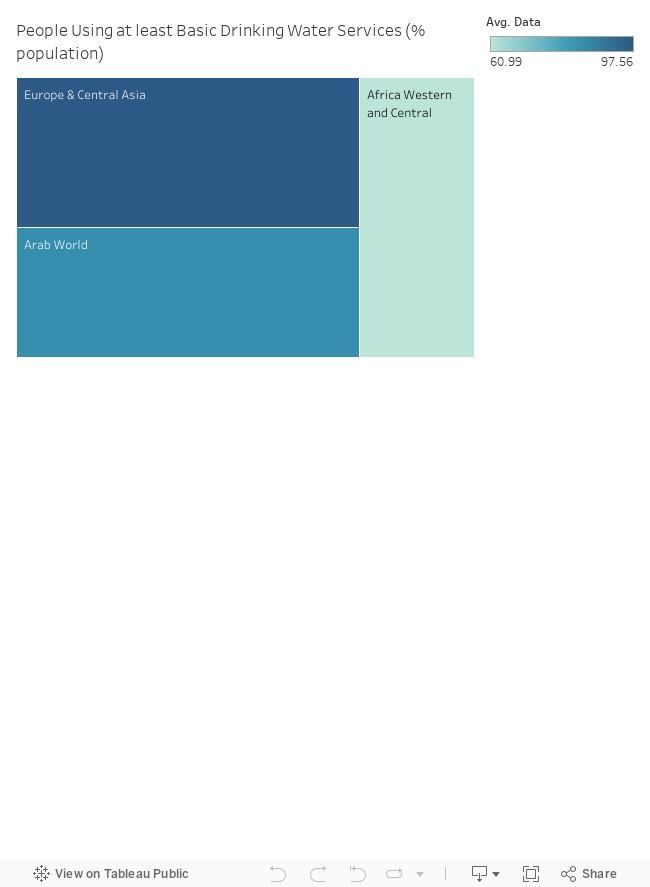
In the heat map below, we can see that Europe and Central Asia in addition to the Arab World have more access to the least basic drinking water services in comparison to Western and Central Africa.
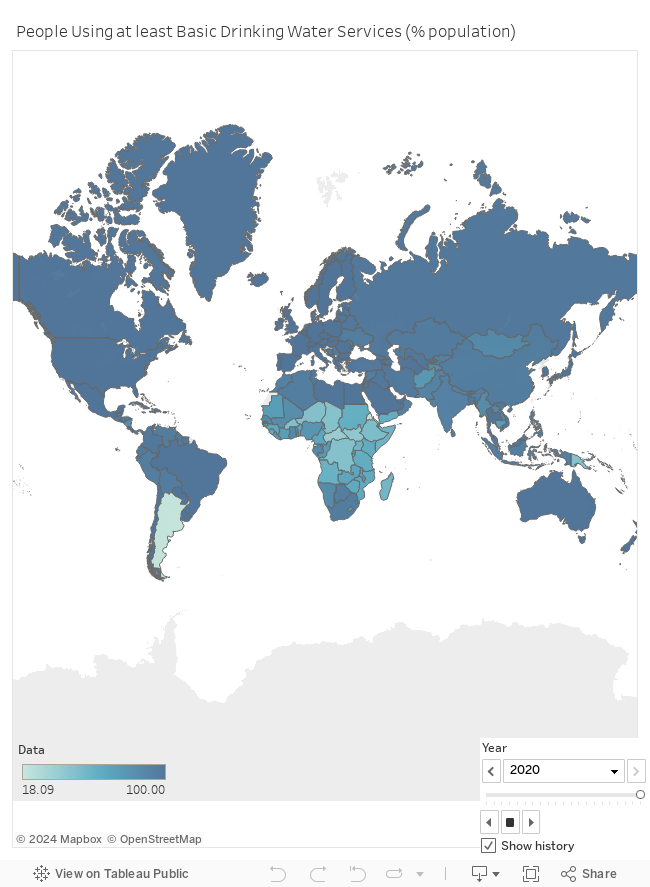
It is also evident in the visual below that throughout the years, countries from all around the world increased their intake of their basic drinking water services except African countries who show a slight improvement.
It is important to note that for you to be able to visualize the changes throughout the years, you need to press on the button at the bottom of the visual!
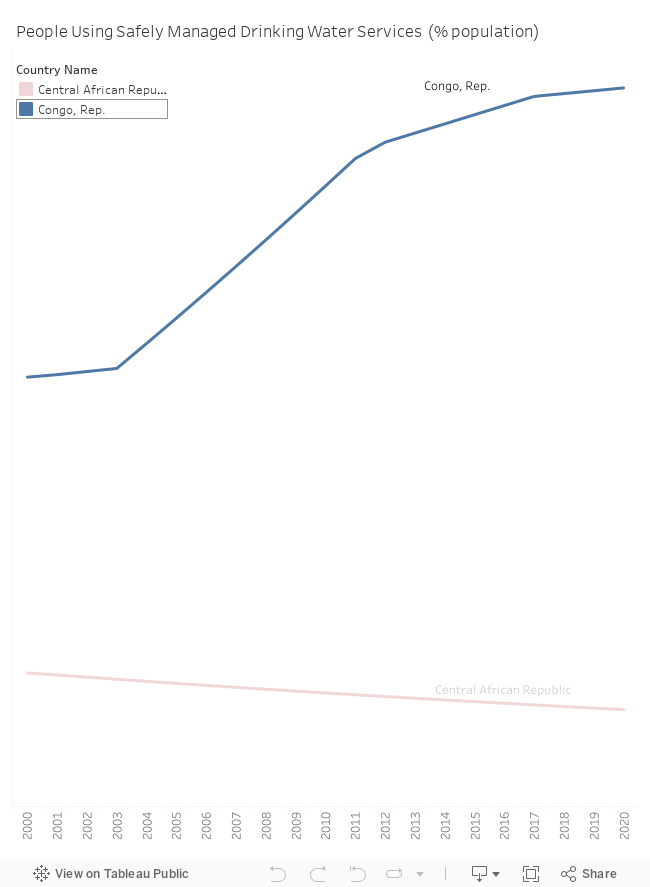
However, with the slight improvements in a few countries, we can still find that other countries (such as the Central African Republic) are still experiencing a decrease on the matter.
It is said that “Thousands have lived without love, not one without water.” – W.H Auden
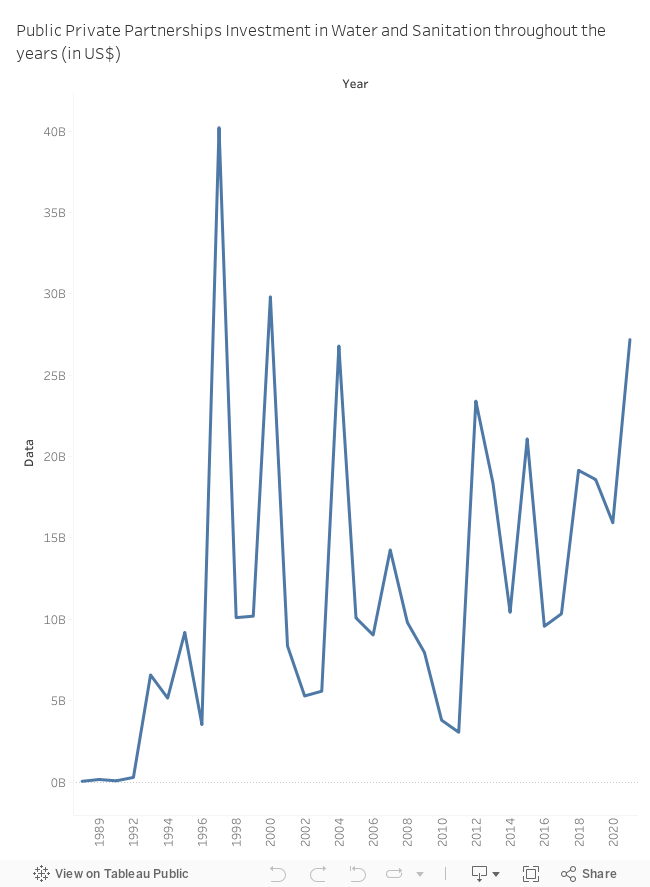
With all these problems being evident, one has to call for action. One of the solutions that have been implemented and has to remain active is increasing the public private partnerships investment in water and sanitation throughout the years (in $US).
This solution has helped increase the access of countries to clean water throughout the years and will continue to do so if implemented more often.
HOW CAN YOU HELP
You can help by donating to NGOs that offer help on the matter. Some examples on the NGOs include: Just a Drop and Planet Water Foundation. Donations can happen through
- Just a Drop: https://www.justadrop.org/?gclid=Cj0KCQiAg_KbBhDLARIsANx7wAwhX9S5ML3JLFVN-sHr8ILJV7kzRmqw7KGJqtRkst0U0gYRFk4aczAaAghWEALw_wcB
- Planet Water Foundation: https://planet-water.org/get-involved/?gclid=Cj0KCQiAg_KbBhDLARIsANx7wAybqNWa-7Q2uPohuNcB94q22-iQPYKTWsEyHcwUgwUmaaRoHDln_hYaAi9WEALw_wcB

by khh09 | May 10, 2021 | Uncategorized

Meet Ahmad
Ahmad is a young and healthy adult who likes to engage in various sports. However, he suffers from severe cases of asthma and regularly takes prescribed medications along with his inhaler. Like many people his age, Ahmad is very ambitious about his future and hopes one day that he can become a world star athlete.
Unfortunately, Ahmad is living in Qatar which is known to have a very harsh environment that is filled with air pollution and CO2 emissions that can risk his healthcare and well being.
Let’s Examine what Ahmad is up against!
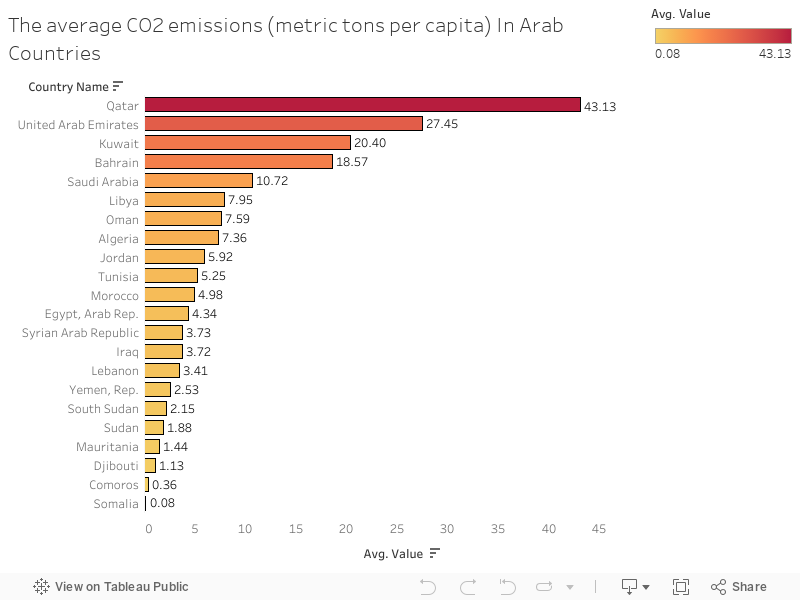
The following Visual is a Bar Chart displaying the average CO2 emissions (metric tons per capita) in Arab countries
Observations

Ahmad was simply shocked!!
Although Ahmad knew that Qatar had very high levels of air pollution, he was not excepting it to be the highest among all other Arab countries. Ahmad had to act fast and think about ways to convince his parents to finance his journey to a cleaner country with low levels of greenhouse gas emissions. However, the previous graph was not entirely convincing for his father since he wanted to have a more visual understanding of the countries.
A better Visual?
The following Visual is the same visual presented before but projected on the map of the Arab World
Before Deciding
 Although it seemed Obvious for Ahmad to travel to any of the countries that had low levels of C02 emissions, Ahmad’s Father wanted his son to have a good future prospect. The father demanded to know which of these countries had low levels of unemployment. After a lot of hard work, Ahmad was able to come up with a great visual that explains exactly what his father wants.
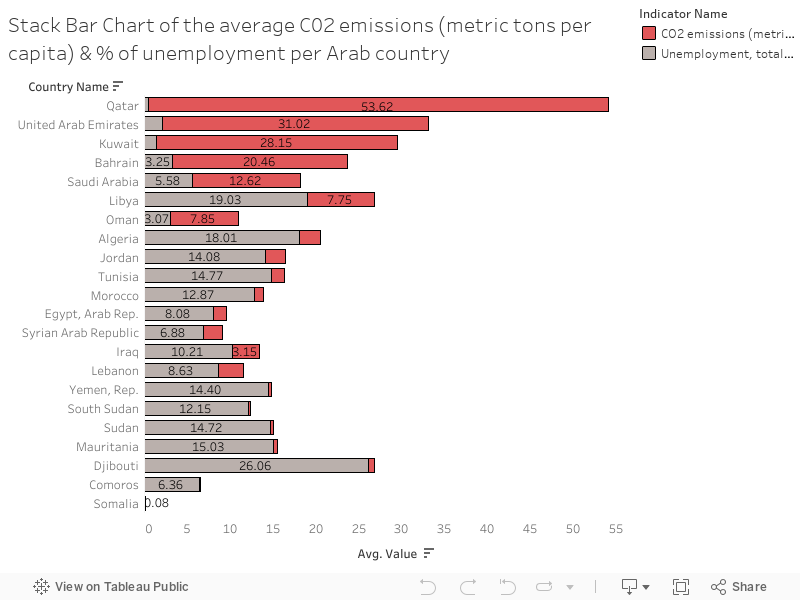
Now That’s Clearer
The following Visual is a Stacked Bar chart displaying the average CO2 emissions (metric tons per capita) and % of unemployment in Arab countries
Problem Solution
| Potential Solutions |
Solution Validation |
Recommendation |
| For Better Future: Convince Ahmad’s father to finance his travel to Saudi Arabia |
it has less CO2 levels (12.62) with slightly higher unemployment rate (5.58%) |
Try Exploring other Non-Arab Countries that meet Ahmad’s requirement |
| For Better Health: Convince Ahmad’s father to finance his travel to Lebanon |
it has significantly less CO2 levels (2.96) but a higher unemployment rate (8.63%) |
If to stay in Qatar for guaranteed employment, Ahmad should drastically change his lifestyle and become more health cautious |
Conclusion
 Ahmad has choices There is no “perfect” solution for Ahmad’s Situation but he has a few options to explore. The problem in our Arab World is that we are (in most cases) required to sacrifice important aspects of our lives to improve other aspects. This dilemma is affecting so many people across the Arab World, especially during these hard times.