Allocating Sales Call Cycles
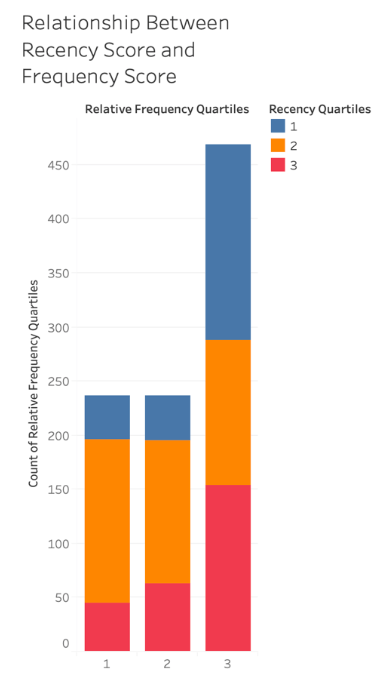
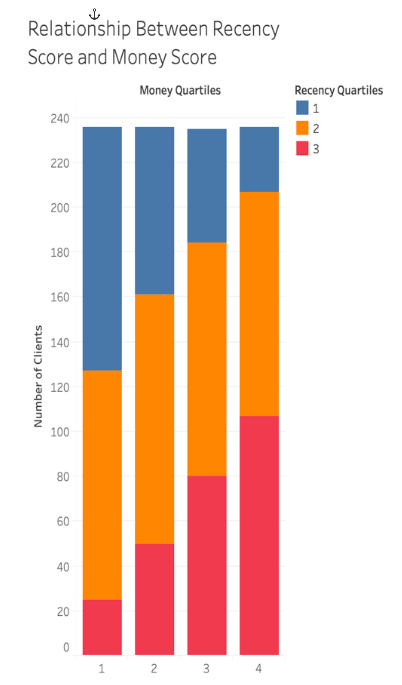
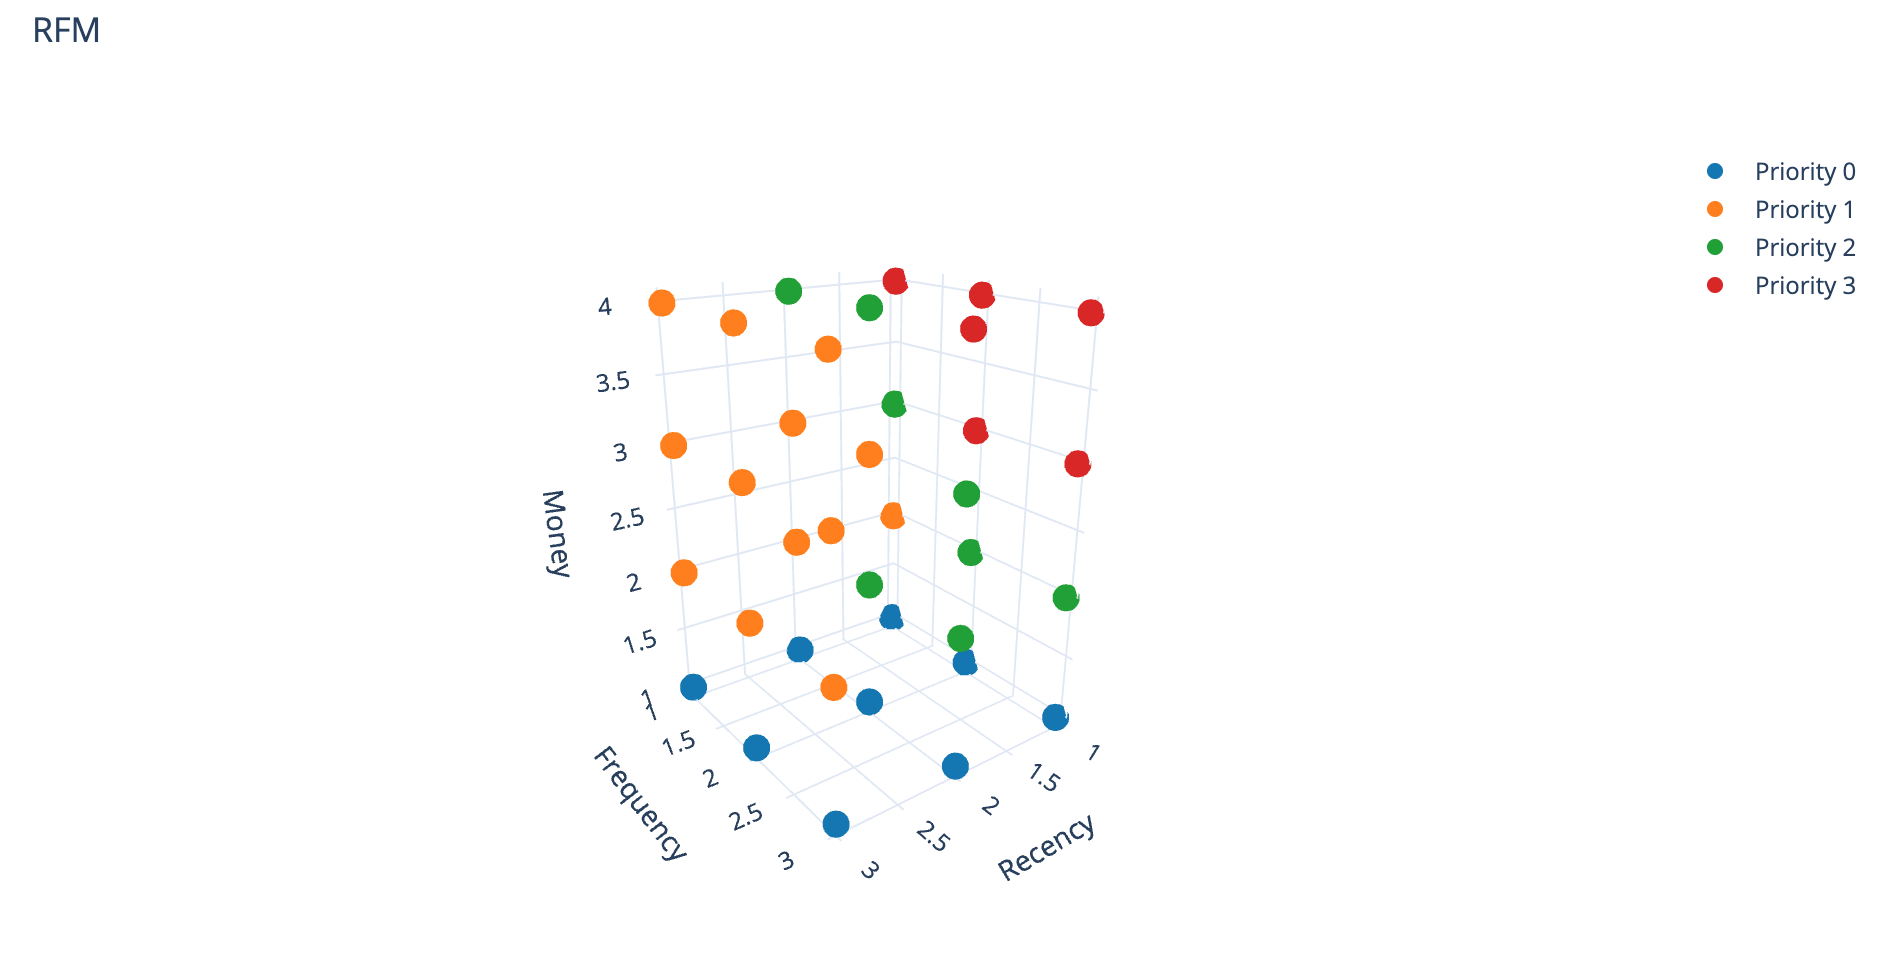
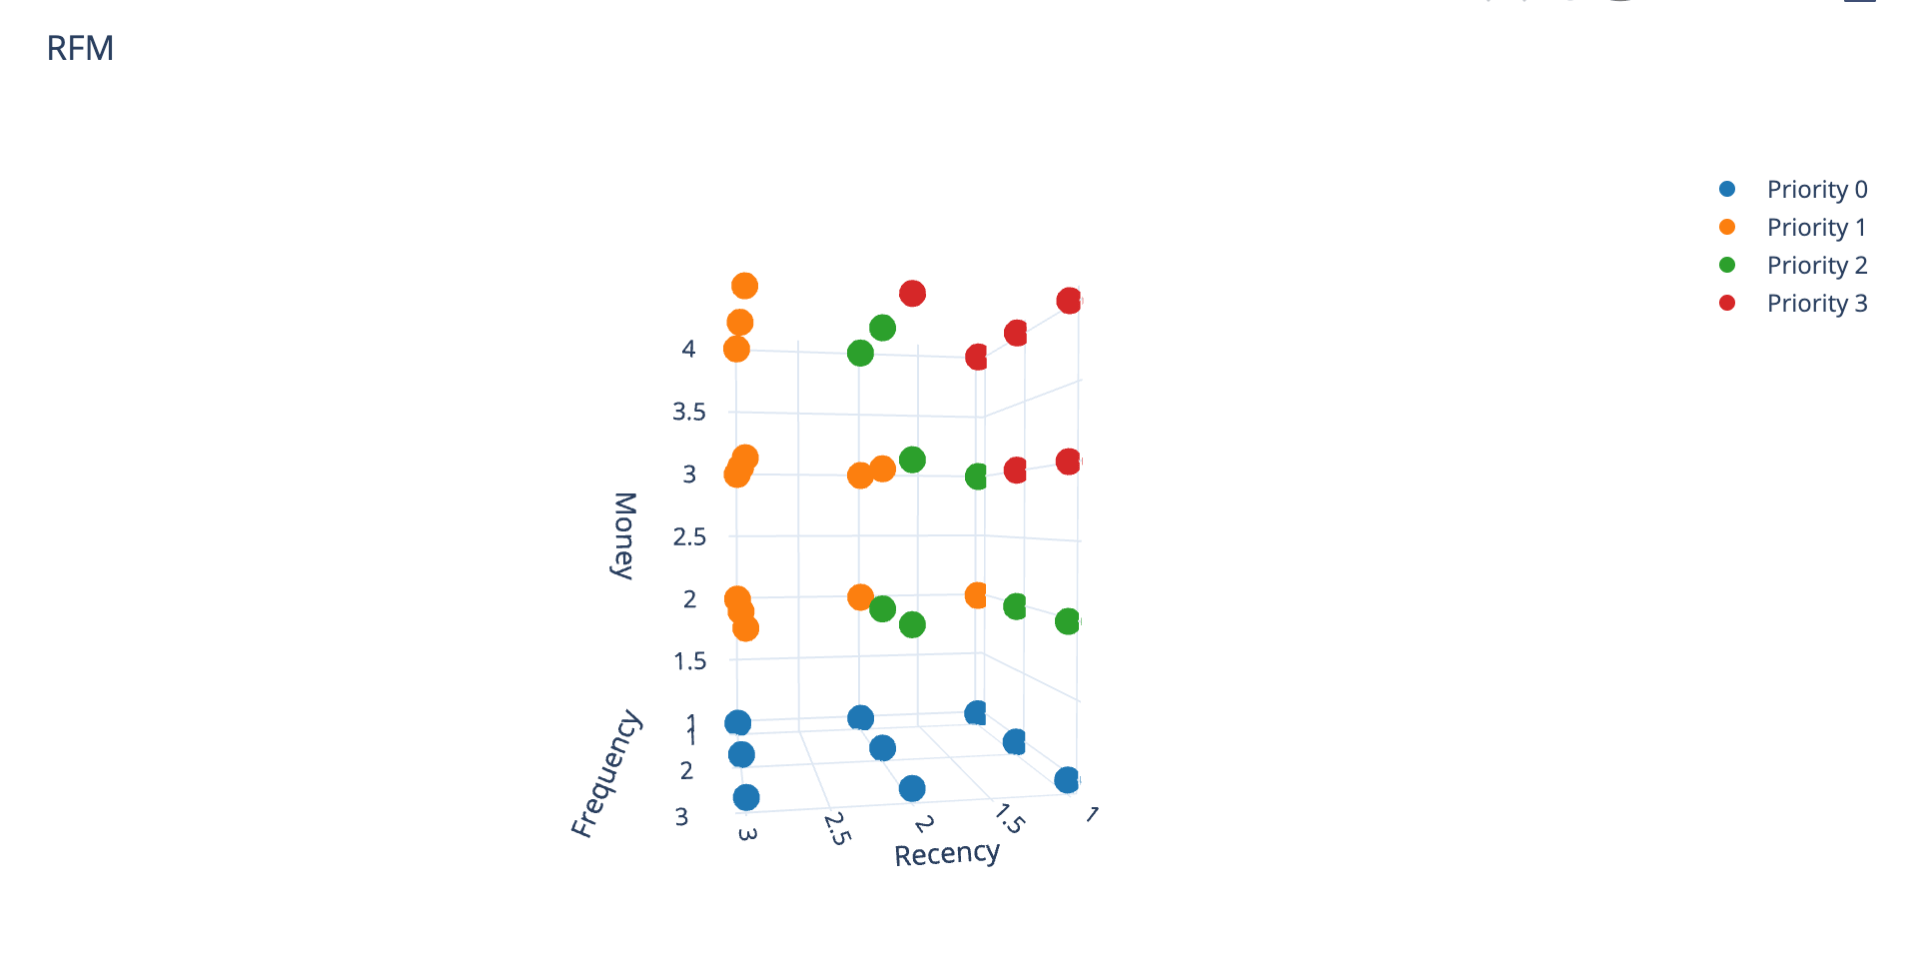
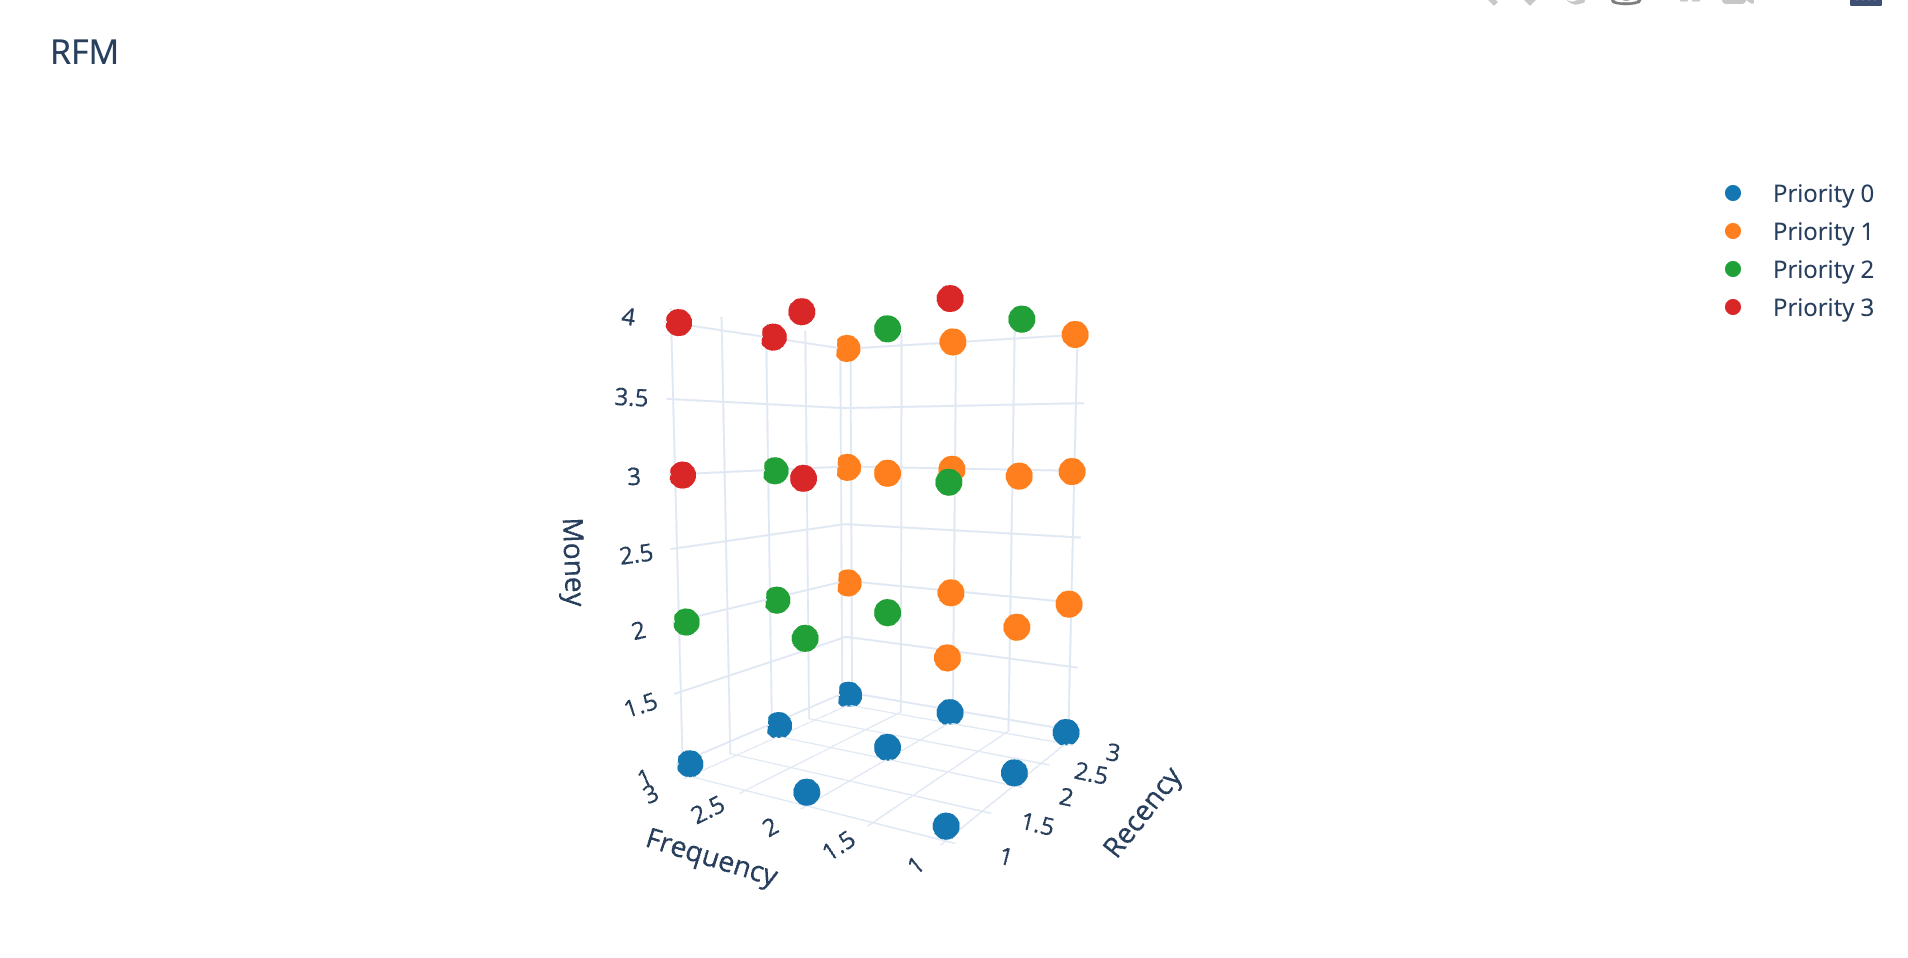
While working on the Sales Call Cycle of a private distributor in Lebanon, we generated the following graph to analyze our clients’ contribution to total revenues. As we observe in the diagram depicting the relationship between the recency score and money score, the clients with higher money scores also have a higher percentage of recency. Those with recency scores of 2, always appear in every money score band. This is probably due to three reasons, in the past year business has not been optimal and only the larger institutions can order consistently, this could also be why this is also the case for why clients with money scores of 3 and 4 most commonly order frequently. The second probable reason is that company keeps a closer eye on larger institutions, so when management realizes that a large client has not ordered in a while, they tend to follow up and get an order. The final reason is that smaller companies tend to run out of business at a much higher rate than their larger counterparts. These businesses might either have ordered once and ran out of work or couldn’t pay their fees on time, and were dropped as a result. For the relationship between recency scores and frequency scores, it makes logical sense that those who have a high frequency have a higher probability of being more frequent. The amount of low recency and high frequency clients that exist is cause for concern. These are frequent clients that haven’t ordered in a while, so there is something unusual about their behavior. For this reason, the company allocated a new sales call cycle to trigger those businesses.