
A Thousand Empty Rooms: Beirut’s Hotel Collapse (2011–2020)
by amk126 | Nov 20, 2025 | Uncategorized
Back in 2020, walking through Beirut felt different. The city that once overflowed with tourists, weekend travelers, and the constant shuffle of suitcase wheels had fallen unnervingly quiet. Streets that were normally alive with hotel valets, café chatter, and late-night crowds echoed instead with a stillness that was impossible to ignore. That silence was more than a mood—it was data waiting to be understood.
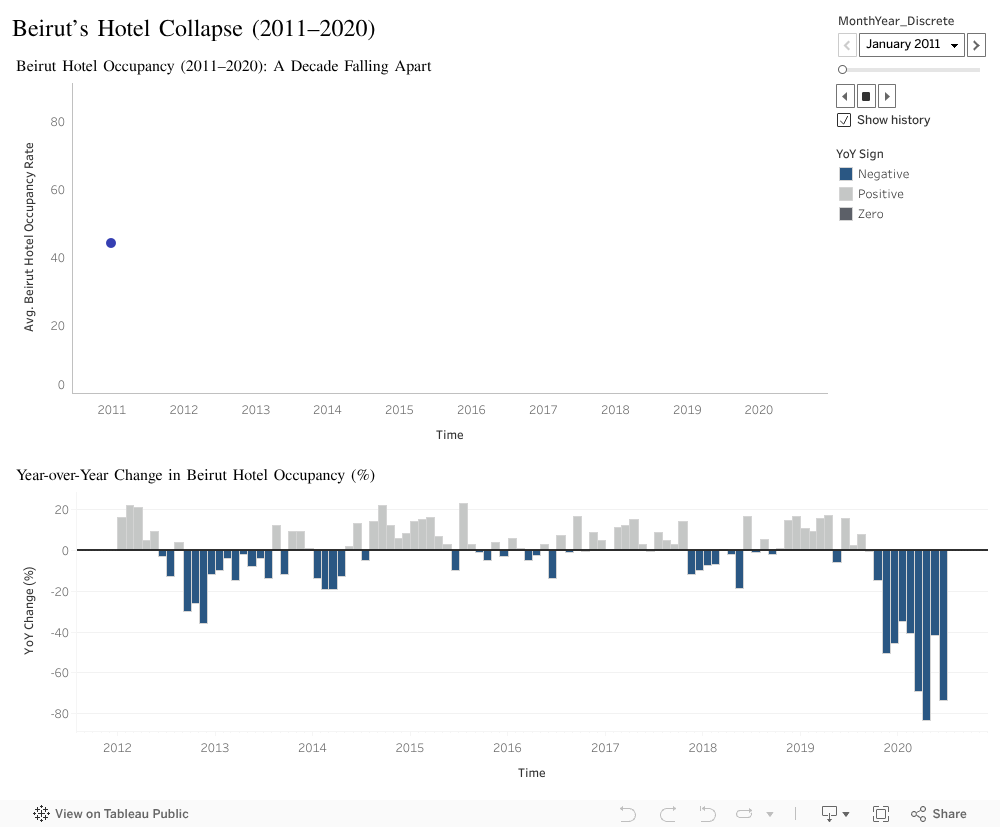
In this visualization, I retrace monthly hotel occupancy rates in Beirut from 2011 to the first half of 2020. For nearly a decade, the line moved in recognizable waves—seasonal peaks, predictable dips, and fluctuations shaped by politics, tourism cycles, and local instability. Despite everything Lebanon had endured, the hospitality sector kept finding its rhythm again.
But as the animation approaches late 2019 and early 2020, something shifts. The familiar pattern fractures. The line doesn’t simply decline—it collapses.
Watching the animation month by month feels almost like watching Beirut lose its breath in real time. In January 2020, occupancy was already strained. By March and April, the numbers didn’t just dip—they plummeted to historic lows. The hotels that once hosted conferences, weddings, and tourists from across the world were suddenly empty.
To make the scale of this collapse clearer, I use a second visualization: the year-over-year (YoY) change. For years, even amid disruptions, positive and negative bars balanced each other out—losses were recoverable, gains still appeared. But in 2019 and especially 2020, the bars plunge into deep negative territory. Some months show declines of more than 70%, marking the most severe contraction the sector had ever experienced.
This wasn’t a gradual decline. It was a cliff.
The causes were layered: the economic crisis accelerating through 2019, the nationwide protests, the currency collapse, and the early months of the COVID-19 pandemic. All these forces converged so quickly that a sector built over decades unraveled in mere weeks.
Seen animated, the data becomes a visual narrative of this unraveling—the rhythm of a city interrupted, its resilience stretched past its breaking point.
Big Idea:
What happened in 2020 was not a slowdown: it was a breaking point. The collapse of Beirut’s hotel occupancy reflects a sector that had survived everything until several crises finally hit at once. The data makes one message clear: when pressure builds over years, failure can arrive all at once, and without warning. Recovery has fortunately already begun, which makes it essential for policymakers to strengthen early-warning systems and support mechanisms so that the hospitality sector can withstand future shocks more effectively.