Data Visualization

Blog of the Data Visualization & Communication Course at OSB-AUB

This is my favorite part about analytics: Taking boring flat data and bringing it to life through visualization” John Tukey

Twenty Years in the Red: Lebanon’s Expanding Services Trade Deficit

Twenty Years in the Red: Lebanon’s Expanding Services Trade Deficit

Lebanon’s service sector should be a national strength — tourism, education, banking, and professional services once made the country a regional hub. But when we look beyond assumptions and into the data, a very different story appears: for 21 straight years, Lebanon has been in the red, importing more services than it exports.

From telecoms and travel to banking and consulting, services play a key function in transforming a country’s economic strength. But for Lebanon, the story hidden in the data tells a completely different reality—one of a consistently growing services deficit over the last two decades.

Looking at 20 years of trade data, I examined how Lebanon’s services balance transformed across key economic periods. The story became immediately clear:
For 21 consecutive years, Lebanon has never escaped a services trade deficit, and the gap continues to deepen.

Why This Matters

For more than twenty years, Lebanon has faced a continuing services trade deficit. The country’s imports, including finance, logistics and professional consulting, have consistently exceeded its exports. The ongoing imbalance heightens economic vulnerability and increases Lebanon’s reliance on foreign service suppliers.

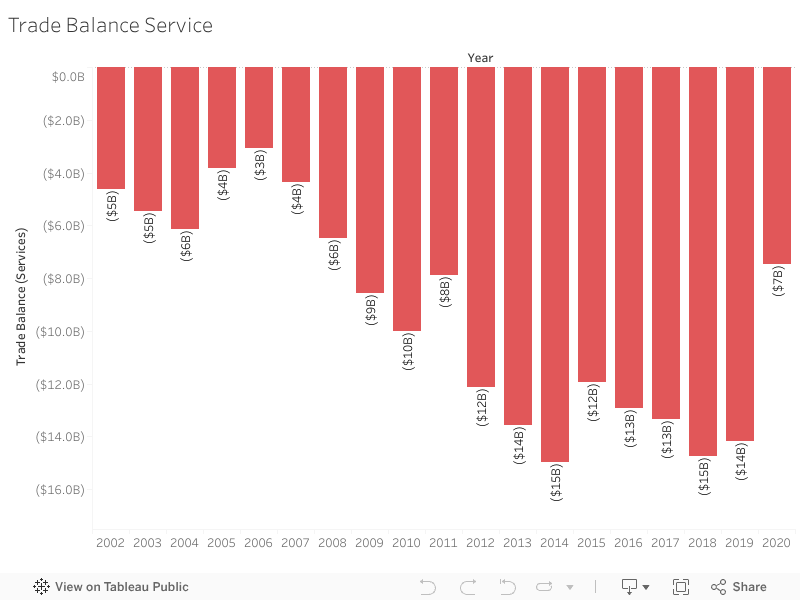
Between 2002 and 2022, the trade balance remained consistently negative. During its 2014-2018 peak, the trade balance deficit surpassed $14 billion, revealing how deeply rooted this issue has become.

The visualization below highlights how this deficit has evolved across key periods.

**Interactive Visualization:**
Hover over the bars to see exact values for each year.

**Full View:**
Complete visualization showing Trade Balance Services from 2002-2022.

Trade Balance Services 2002-2022

During the pandemic in 2020, the deficit slightly decreased—mainly due to reduced travel and service utilization. Unfortunately, this improvement is temporary. In 2021 and 2022, the deficit rises again, continuing the very trend Lebanon has struggled with for years.

What This Means

A persistent services trade deficit highlights structural vulnerabilities. It reveals that Lebanon is consistently spending more on imported services than it generates from exports. With time, this imbalance becomes a financial burden that weakens financial stability and increases dependence on external inflows.

The Big Idea

Examining two decades of data highlights how Lebanon’s service trade deficit has continued to expand, revealing Lebanon’s economic vulnerability. The figures are striking on their own, but when presented as a story, the patterns become impossible to overlook.

What Can Lebanon Do?

Reducing the services deficit requires structural changes rather than short-term fixes. Strengthening digital services, tourism, and healthcare exports can create new revenue streams. Supporting export-oriented SMEs — especially those providing regional outsourcing services — can also help Lebanon compete more effectively.

Policy efforts should focus on promoting digital transformation, encouraging service-based startups, and building stronger regional trade partnerships. Over time, these measures can help diversify Lebanon’s export base, reduce dependency on imported services, and move the country toward a more sustainable trade position.

For example, Lebanon’s IT outsourcing sector—especially remote consulting and digital services—has grown naturally since 2020 and can become an export engine if supported through training and regional partnerships.
 

Unequal Access: Mapping Lebanon’s Education Divide

Unequal Access: Mapping Lebanon’s Education Divide

Thousands of students in Lebanon are underserved by the concentration of educational opportunities in a small number of governorates. Policymakers must make investments in areas that lack public branches, colleges, and educational resources in order to create a more inclusive future.


1. A Landscape of Uneven Learning Opportunities

Lebanon’s education system has long been viewed as a regional strength but this strength is not evenly distributed. By mapping universities, Lebanese University (LU) branches, and the availability of educational resources across governorates, a clear pattern emerges: a select few governorates enjoy strong coverage, while others have limited or almost no access.

The visualization shows that:

  • Baabda, Zahle, and Matn dominate in the number of universities.

  • Meanwhile, areas like Bsharri, Batroun, Hermel, and Hasbaya have only 1 or zero universities.

This imbalance shapes future opportunities. Where a student is born should not determine how far they can go but right now, it often does.

2. Public Higher Education Is Even More Concentrated

Access to affordable education is even more unequal.

  • Zahle and Matn lead with 5 and 4 LU branches.

  • Many areas including Tyre, Akkar, Zgharta, Hasbaya, Hermel have one or no branches.

  • Several governorates have none at all, forcing students to relocate or drop out.

This reinforces a cycle: private universities cluster in the center, while public universities remain scarce outside major cities.

3. The Coverage Index: How Many Citizens Each University Serves?

To measure real accessibility, the coverage index compares each region’s population to the number of universities available.

Here the gap becomes dramatic:

  • In Baabda and Matn, one university serves fewer than 200,000 people.

  • In Hermel, Bsharri, and Tripoli, a single university covers more than 300,000 residents.

The message is clear: some regions are overserved, while others are severely underserved.

4. Do Educational Resources Exist Where They’re Needed Most?

When we look at the distribution of educational resources—libraries, cultural centers, labs, and learning facilities another pattern emerges:

  • Akkar, Baalbek, and Baabda have the highest counts.

  • Remote districts like Bsharri, Hermel, Batroun, and Marjeyoun have almost none.

This highlights a critical insight:
some areas have the right infrastructure but lack universities, while others have universities but no supporting learning ecosystem.

5. What This Means for Lebanon

Lebanon’s most significant educational challenge is not quality but fairness.
The maps reveal a structural inequality that affects:

  • university enrollment

  • student mobility

  • long-term employment opportunities

  • economic development in rural areas

By investing in the regions with the lowest coverage and resource availability, Lebanon can create a more inclusive and productive society.


Call to Action

We recommend a targeted educational investment plan for underserved governorates, focusing on:

  • Opening new LU branches in areas with zero public presence

  • Strengthening educational resources where population density is high

  • Supporting private institutions willing to expand beyond major districts

  • Digital learning infrastructure for remote areas

Education shouldn’t depend on geography. With intentional planning, it doesn’t have to.