by lbi01 | Nov 19, 2023 | Uncategorized
Lives at Stake: Mortality and Water Challenges.
At the heart of a global crisis lies the pressing issue of high mortality rates attributed to unsafe water, inadequate sanitation, and a lack of proper hygiene. This dire circumstance is vividly illustrated on our global map, particularly in regions like Niger, Chad, Nigeria, and others. The consequences are severe, as communities grapple with the devastating impact of water-related diseases. Lives are at stake daily, underscoring the urgent need for intervention. Throughout this visual narrative, we aim to illuminate the connections between unsafe water access, sanitation challenges, and the absence of basic hygiene, portraying a compelling story that urges a collective commitment to sustainable solutions.
Hands Tied: Hygiene and Mortality Correlation
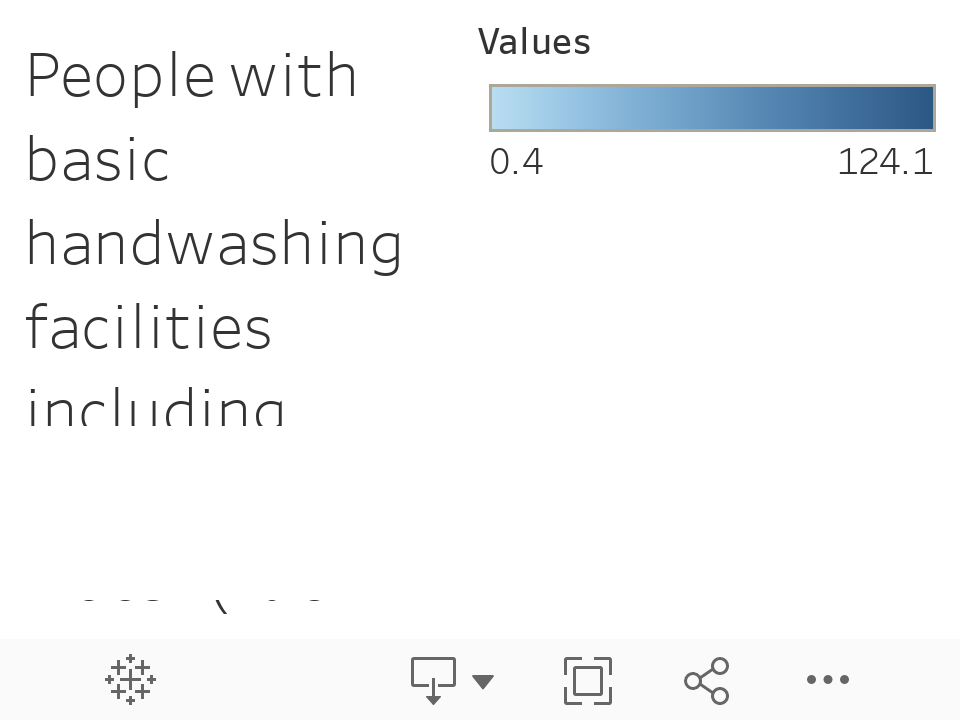
Let’s zoom in on a crucial aspect: washing hands. It turns out that having proper handwashing facilities, like soap and water, is a big deal. It’s not just about clean hands; it’s a powerful defense against diseases caused by unsafe water. Our bar chart will show you how this simple act is connected to the number of people getting sick or, unfortunately, losing their lives. The takeaway is clear: we need to step up and make sure everyone has easy access to soap and water. It’s a basic step, but it can make a huge difference in keeping communities safe from water-related illnesses.
The Root Causes
Environmental Factors
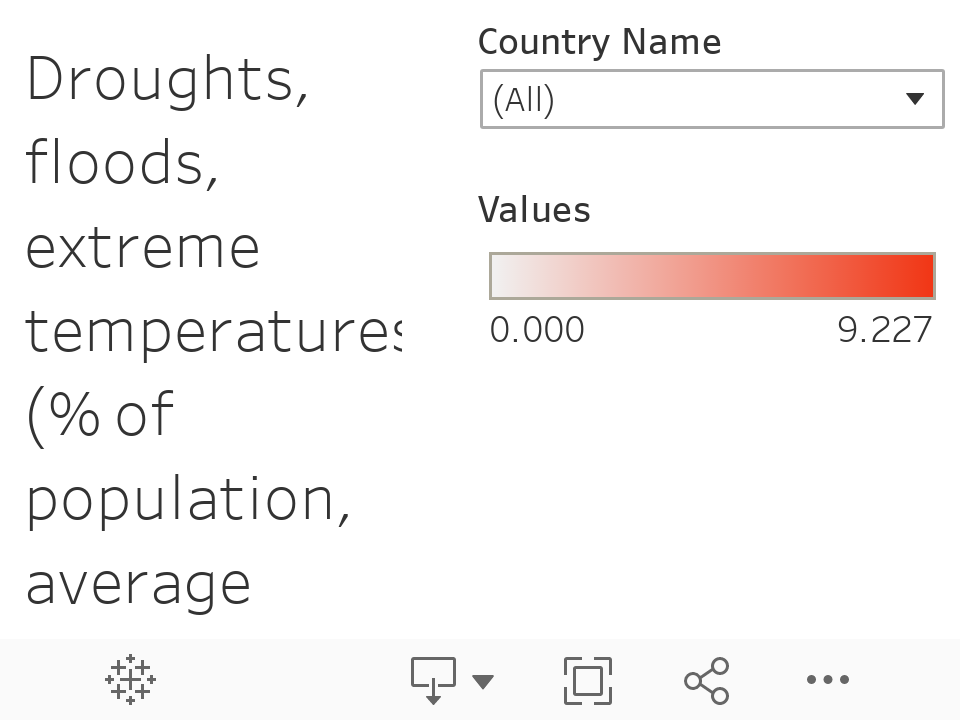
Imagine not having enough rain (droughts) or it being super hot (extreme temperatures). This, along with big changes in the climate, makes life harder, especially for getting clean water. Our map shows where these tough conditions hit the most. It’s like a puzzle – understanding how the environment adds to the challenges people face, making it more difficult to stay healthy and safe.
Urbanization’s Impact
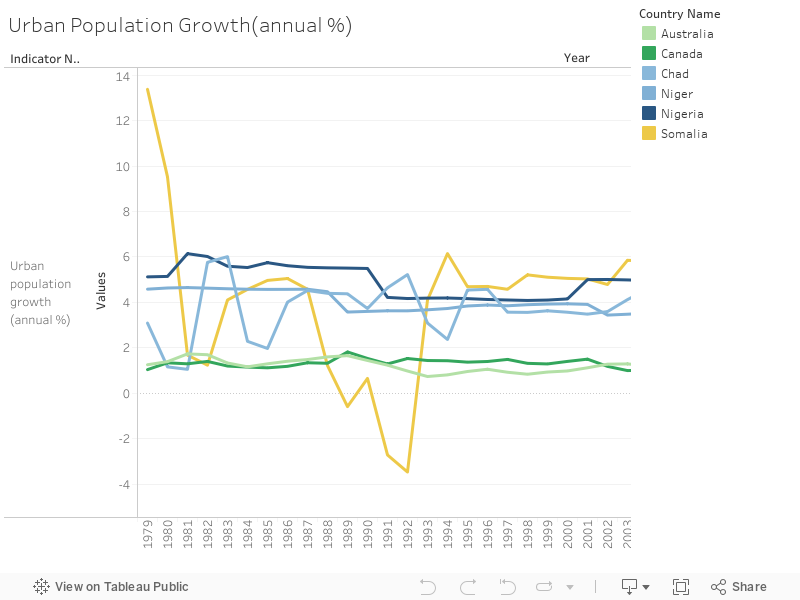
Let’s explore what happens when cities grow rapidly. As more people move in, the demand for water rises, creating challenges in maintaining clean and accessible water sources. This, in turn, affects sanitation and has implications for health and mortality rates. Our examination sheds light on the difficulties urban areas encounter in ensuring adequate water access and sanitation amidst swift urbanization.
by fin03 | Nov 19, 2023 | Uncategorized
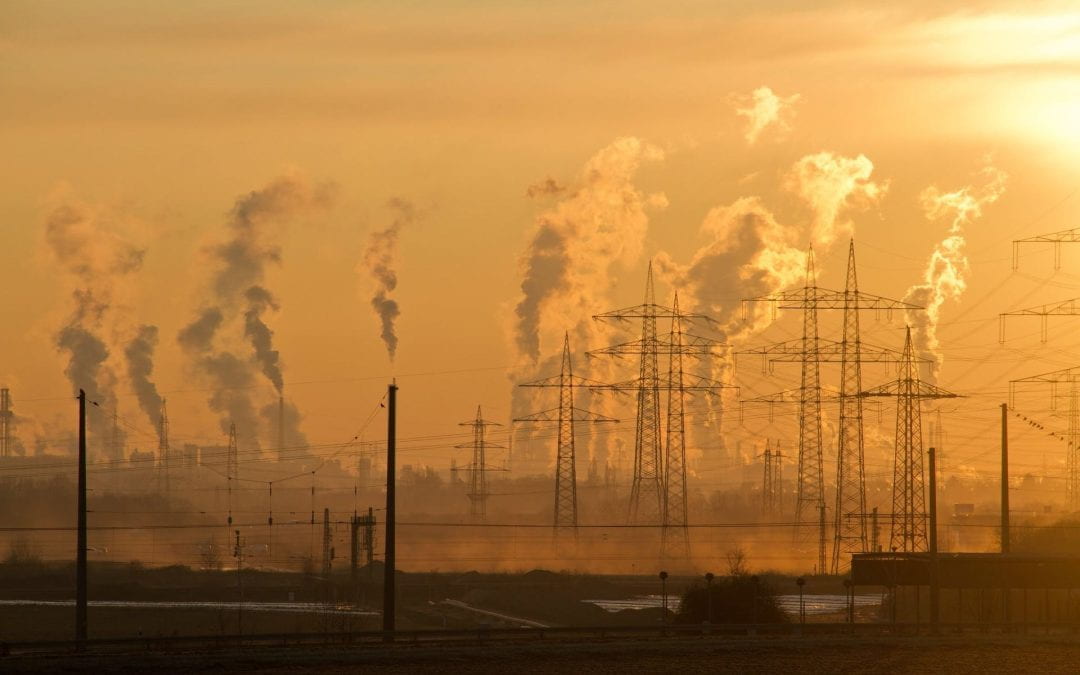
Addressing the global challenge of greenhouse gas emissions is imperative, with gases like CO2, CH4, and N2O significantly impacting our environment. These gas trap heat, contributing to global warming and climate change, with consequences extending to poor air quality, health issues, and disruptions in temperature and precipitation patterns.
Why address the issue in China specifically?
The focus on China is crucial as it plays a pivotal role in this challenge, contributing 27% of global CO2 emissions and one-third of the world’s greenhouse gases. These compelling statistics, sourced from a recent World Bank report, emphasize the urgency of recognizing and addressing China’s role. Crafting effective global strategies for mitigating greenhouse gas emissions requires a nuanced understanding of China’s significant impact on this critical issue.

Charts:
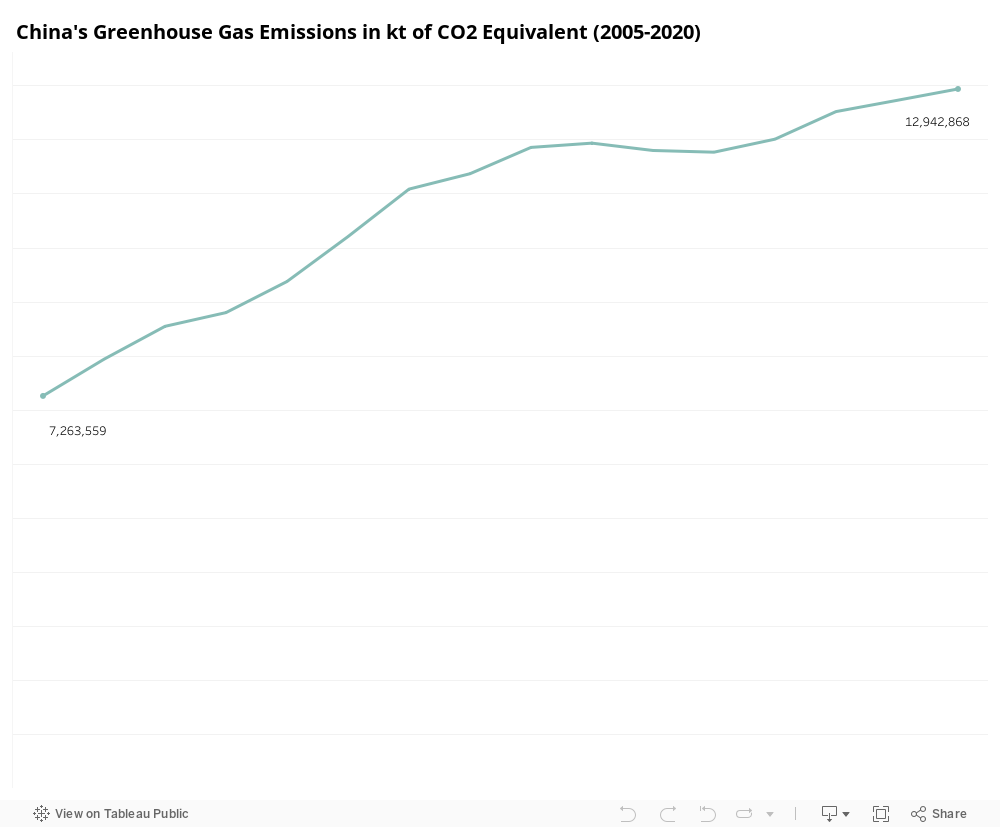
The below line chart illustrates China’s greenhouse gas emissions in kilotons of CO2 equivalent from 2005 to 2020. The graph depicts a consistent upward trend, starting at nearly 7.3 million kt in 2005 and reaching 13 million kt in 2020
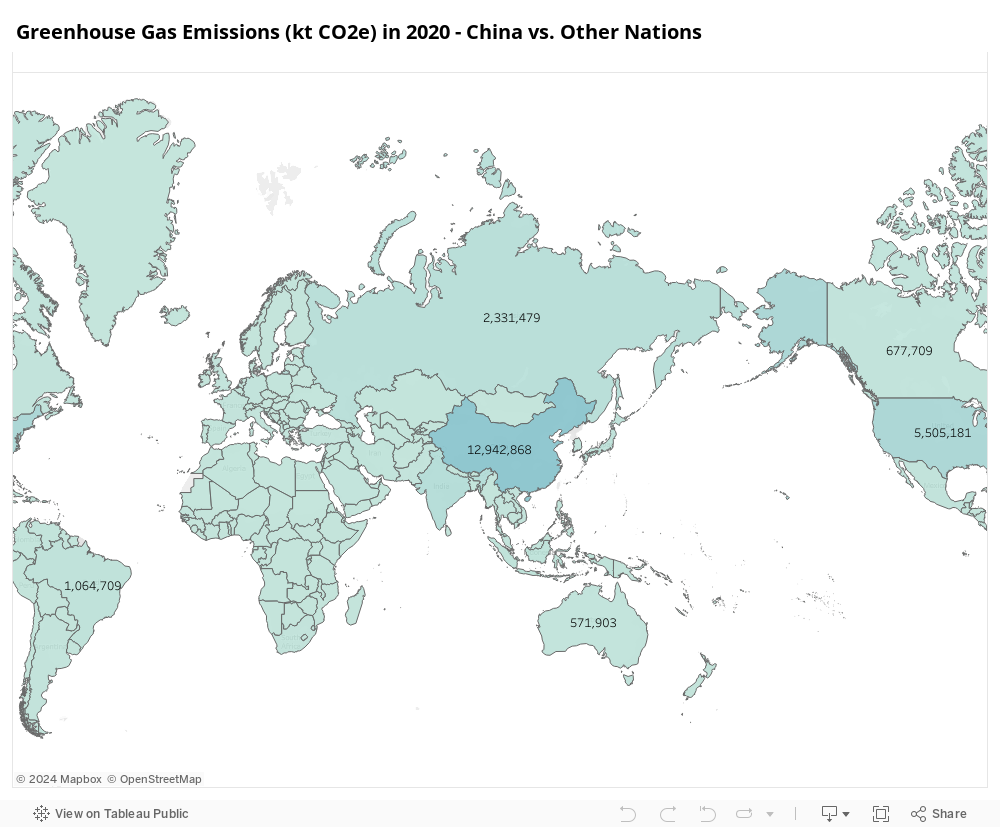
The following map offers a comparative analysis of greenhouse gas emissions between China and other nations in 2020. The stark contrast is evident, with China recording almost 13 million kt, while Russia stands at 2.3 million kt, Brazil at 1.6 million kt, the USA at 5.5 million kt, and Canada at 6.7 million kt. These figures underscore the alarming magnitude of the issue emanating from China.
Contributing Factors to China’s Environmental Impact:
1) China as Global Manufacturer: As the world’s largest manufacturer, China’s robust industry and escalating energy demand significantly contribute to emissions. Fossil fuel combustion for energy production and manufacturing processes plays a central role in the nation’s substantial carbon footprint.
2) Agricultural Impact: Methane emissions from livestock and rice paddies contribute significantly to the intricate landscape of greenhouse gas sources.
3) Urbanization and Infrastructure Development: The construction and operation of buildings, roads, and transportation systems play a role in the environmental challenge.
4) Consumption Patterns: China’s growing middle class and consumer culture contribute to increased demand for goods, impacting production-related emissions.
The lifestyle choices and consumption patterns of the population contribute to the overall carbon footprint.
Comprehensive Solutions for a Sustainable Future:
1) Renewable Energy Transition: Transitioning to renewable energy sources, like wind and solar power, is crucial for reducing reliance on fossil fuels and mitigating emissions.
2) Energy Efficiency Measures: Implementing energy-efficient technologies across industries minimizes emissions in transportation, manufacturing, and construction.
3) Circular Economy Practices: Encouraging a circular economy reduces waste and promotes the reuse and recycling of materials, fostering sustainability.
4) Carbon Capture and Storage (CCS): Investing in CCS technologies captures and stores carbon emissions from industries, playing a key role in emission reduction.
5) Global Collaboration: Collaborating globally on research and technology sharing strengthens efforts to combat climate change effectively.
Final Thoughts:
The urgency to address this challenge is not just a national responsibility but a global imperative. By adopting sustainable practices, embracing clean technologies, and fostering international collaboration, we can collectively steer the trajectory towards a more environmentally resilient future.

by mse47 | Nov 19, 2023 | Uncategorized
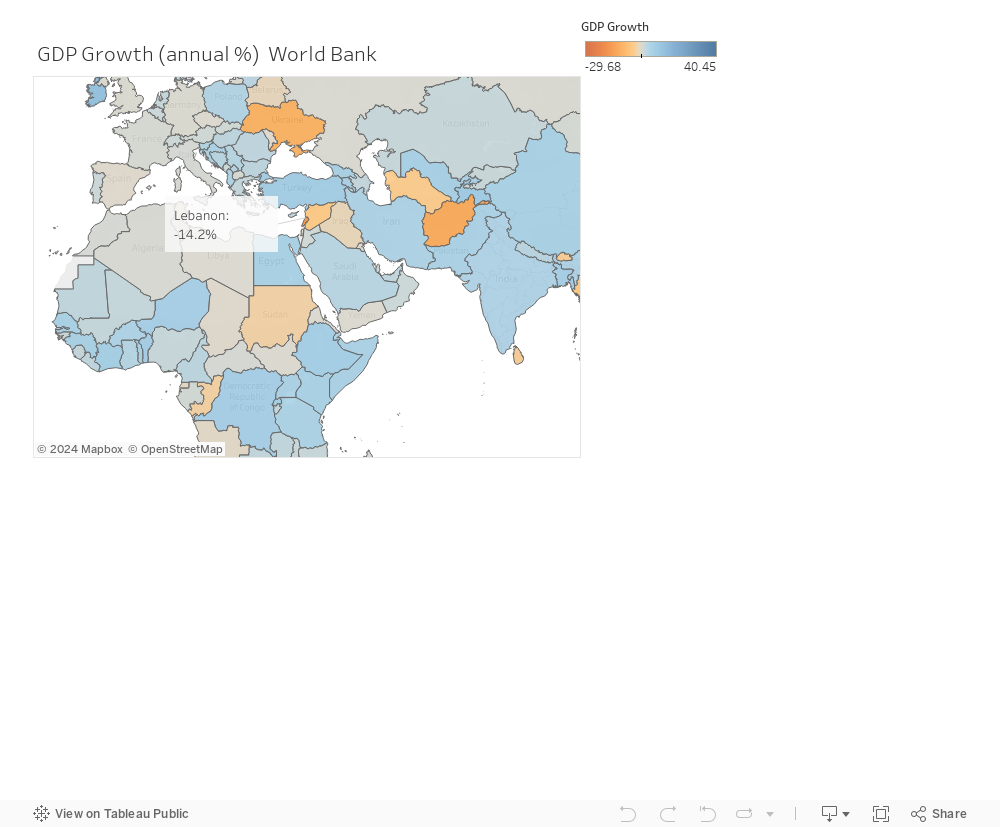
Lebanon has been ranked as one of the top countries with severe negative GDP growth. As shown in the below graph, Lebanon’s GDP growth is also lower than that of its neighboring countries, including Syria which has been facing a war since 2011.
In order to check for potential causes of this severe negative GDP growth, Lebanon was compared with other countries on the level of economic indicators. What is found interesting is that Lebanon has the highest external debt (expressed as % of GNI) compared to other countries, as the below figure shows.
Let’s dig deeper into the relationship between external debt and GDP growth in Lebanon. As the below figure shows, when Lebanon’s external debt made a big jump and increased by 130% (from 147% to 277.9%), GDP growth had a severe decline of 15.5% (from -4.2% to 19.7%).
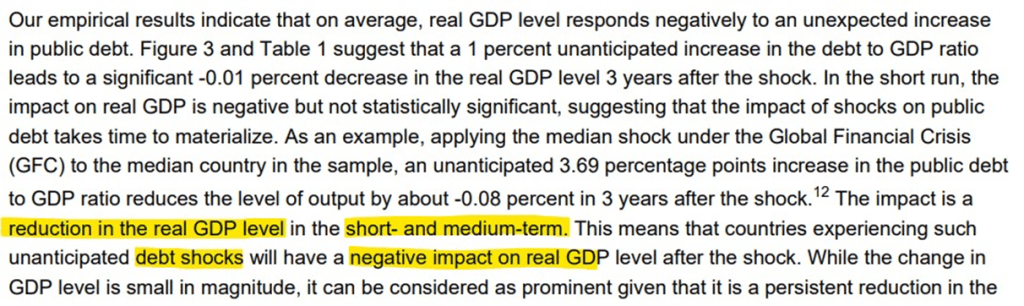
This relation is validated by a study performed by The Monetary Fund that states that external debt shocks have a negative impact on GDP in both, the short- and medium-terms. This is further shown in bellow screenshot taken from the study (The Monetary Fund,2022).
For this reason, The Monetary Fund, in collaboration with the World Bank, has developed The Heavily Indebted Poor Countries (HIPC) Initiative that provides debt relief for qualifying countries if these countries develop a Poverty Reduction Strategy Paper (PRSP) to show how this relief would help them re-increase there GDP.

by rmr34 | Nov 18, 2023 | Uncategorized
Education:
Education is the cornerstone of development, unlocking doors to a brighter future. Education plays an essential role in achieving the Sustainable Development Goals (SDGs). The persistent challenge of education in African countries, particularly for adolescents, has always been an obstacle, contributing to the developmental lag experienced of these nations.
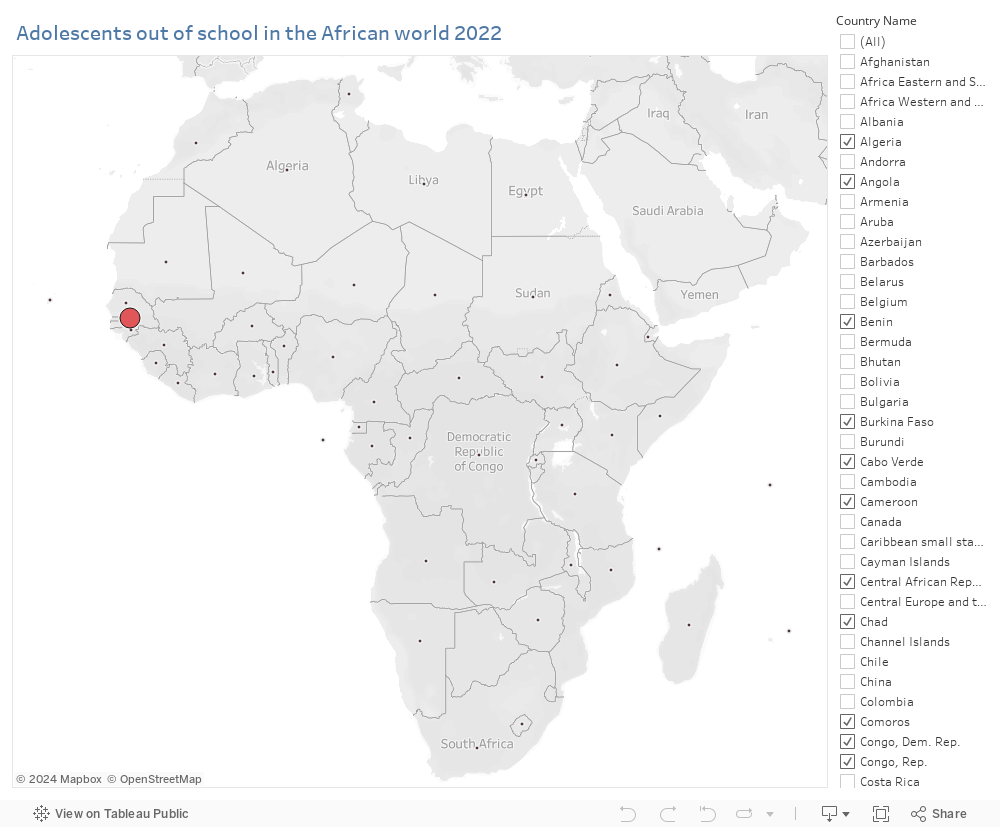
Adolescents out of school in 2012:
In 2012, a large percentage of adolescents were out of schools. Reasons vary but they can be summarized in
- Inadequate educational infrastructure
- Social disparities especially marriage
- Barriers to access in rural areas
- Shortage of qualified teachers
- Limited access to modern teaching materials
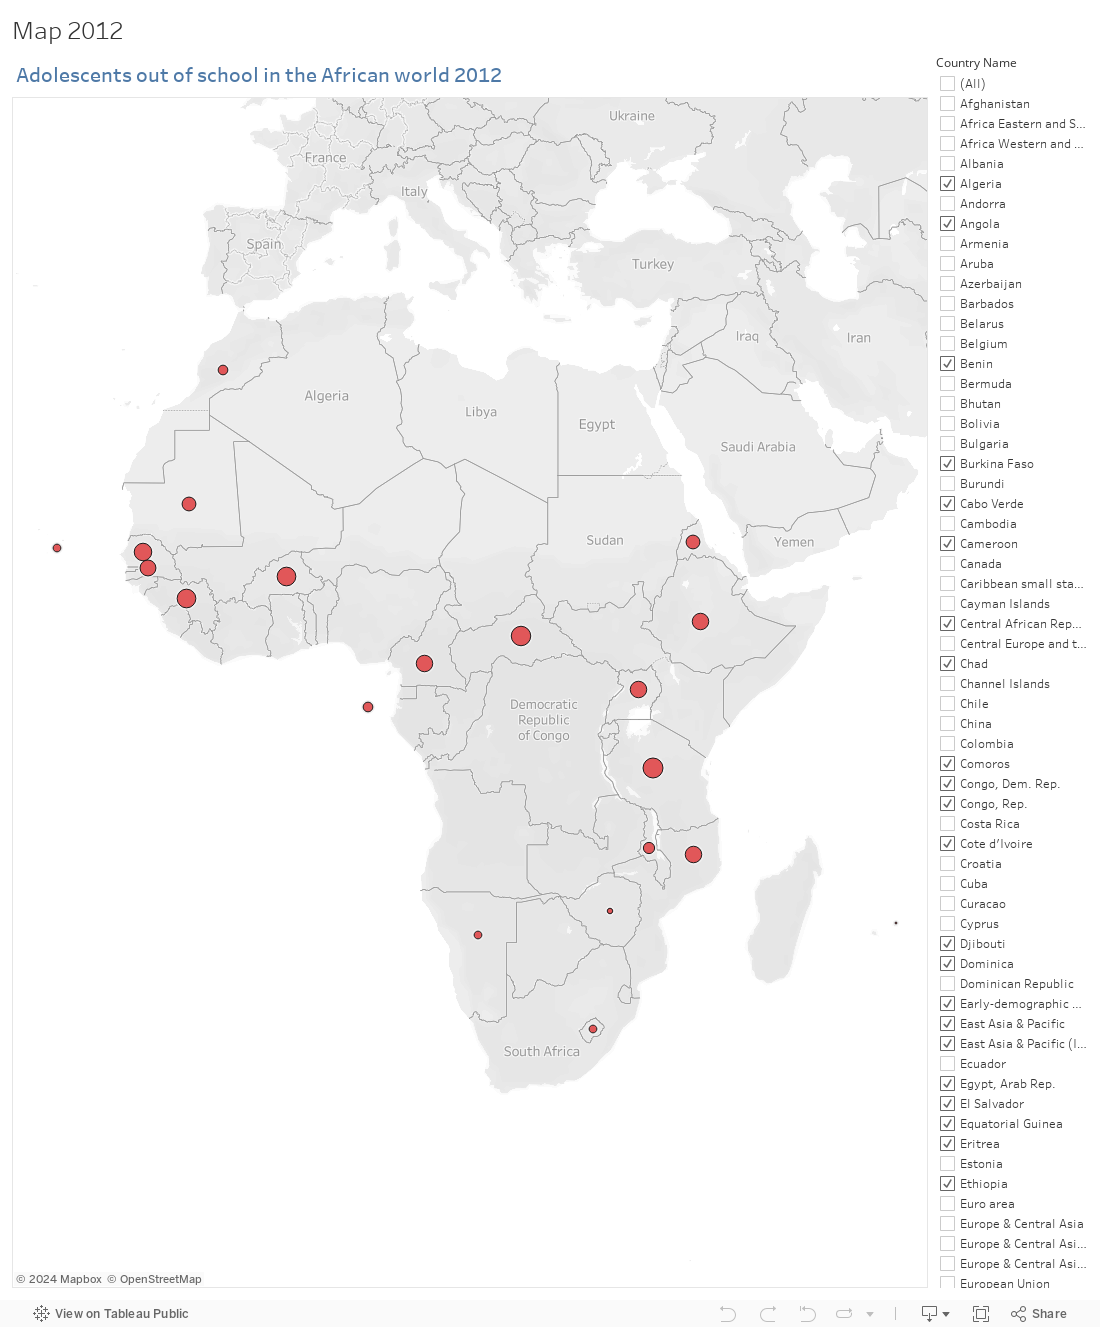
Adolescents-out-of-school rate in African Countries:
The map assures visually and represents educational challenge with larger red circles denote higher percentages where the adolescents-out-of-school rate is really high in comparison to other countries.
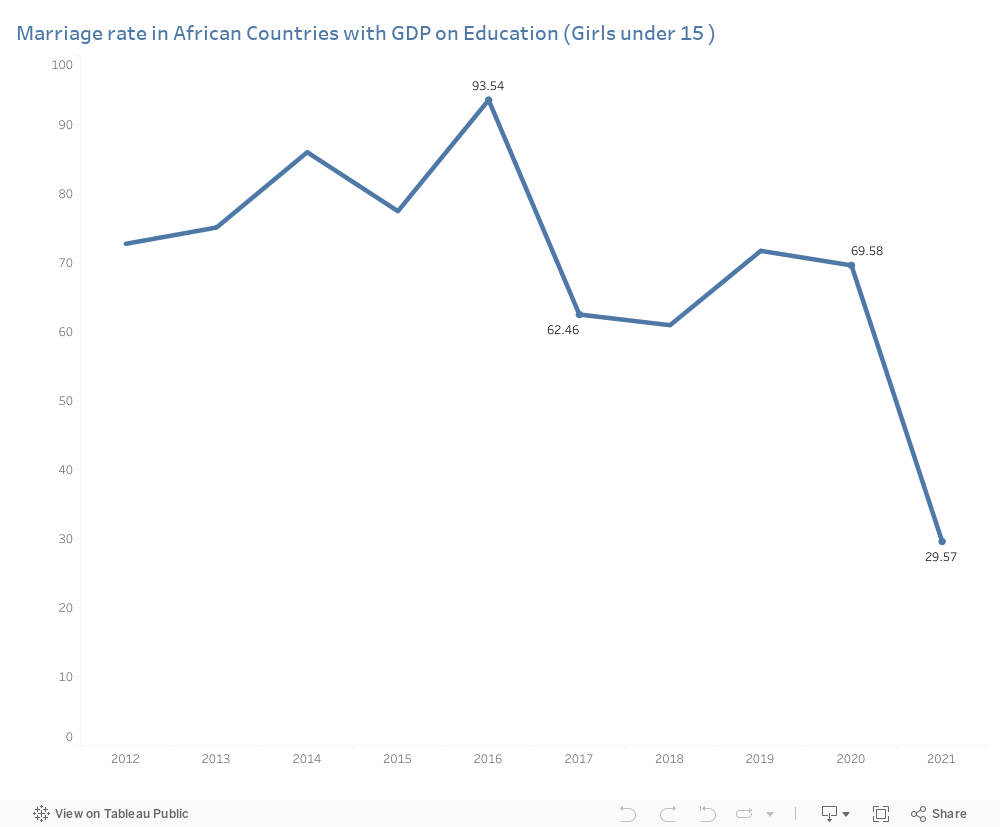
Early Marriage
The high marriage rates in often limit access to formal learning opportunities. The social expectations surrounding marriage can act as a barrier, particularly for young girls, impeding their ability to complete their education. However, fast forward to 2022, a shift in the educational landscape had occurred. In 2016, marriage rates for girls under 15 stood at a shocking 93%. However, a line chart traced a journey of change from 2016 to 2017, witnessing a substantial drop to 62%. The trend continued into the years 2020 and 2021, where the marriage rate further decreased to a promising 29%.
Now, this shows the rate of out-of-school adolescents that had fallen. Hope began to blossom becoming an inspiration of progress in the (SDGs).
Correlation between Marriage and School enrollment:
The story unfolded with a realization – the decline in early marriages played a key role in fostering educational empowerment with a correlation between decrease in marriage rates and increase in school enrollment. Yet, a small number is still beyond the ideas of education.
Urgent Call for action:
- Community Engagement and Awareness
- Investment in Infrastructure
- Government Policy Reforms
- Teacher Training and Support
- Partnerships with NGOs and Corporations
- Monitoring and Evaluation
The tale of progress in African education reminds the world that transformation is possible when communities unite, prioritize education, and nurture the dreams of their youth…

by rei04 | Nov 18, 2023 | Uncategorized
In our global journey towards the Sustainable Development Goals (SDGs), closely examining reproductive trends offers a window into the successes and ongoing challenges of public health initiatives. This post presents an updated analysis of birth rates over the decades and current adolescent fertility rates in key nations.
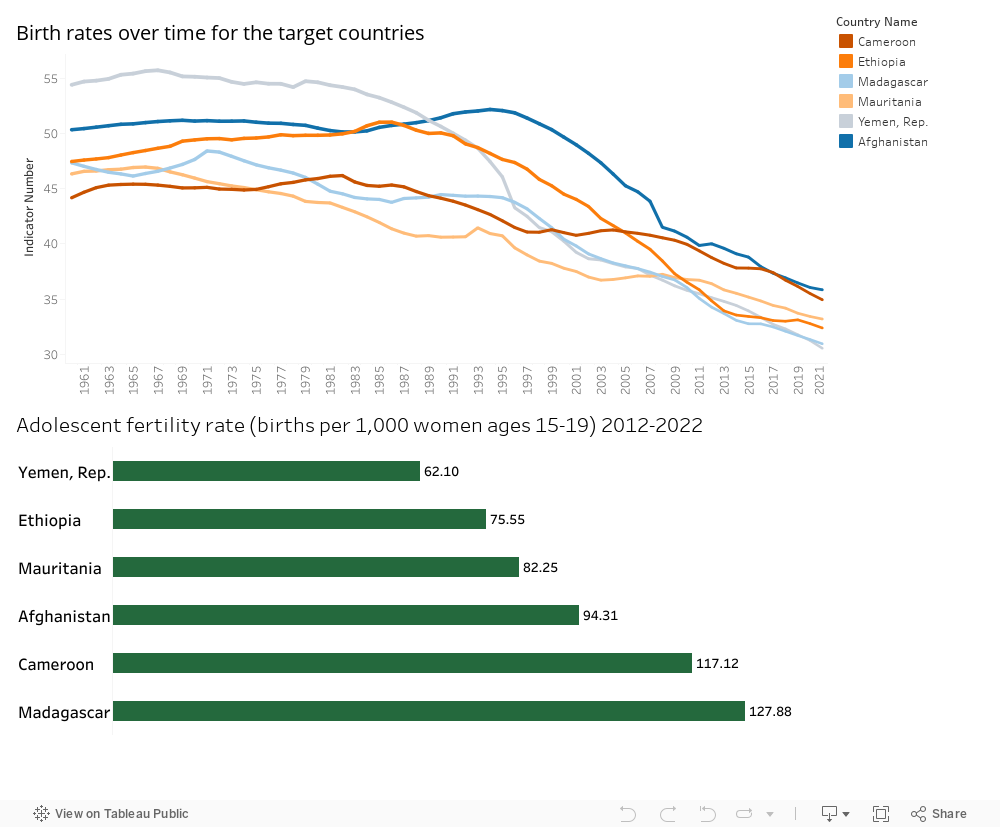
Our line graph traces the paths of birth rates in countries like Afghanistan, Cameroon, Ethiopia, Madagascar, Mauritania, and Yemen from the 1960s onward. While there is a shared downward trajectory, each country’s journey reflects unique socio-economic and healthcare factors influencing these rates.
Complementing the long-term view, the bar graph presents a snapshot of the current state of adolescent fertility rates. This data is critical as it highlights the fertility patterns among young women, which is a key indicator of access to education and reproductive health services. Madagascar and Cameroon exhibit the highest rates, signaling areas where interventions may be most needed.
Together, these visuals offer a comprehensive perspective on reproductive health. The historical data of birth rates inform us of overarching progress, while the adolescent fertility rates give us a focused understanding of where additional efforts are necessary, particularly in empowering young women.
These reproductive trends are intimately linked to SDGs 3, 4, and 5, which emphasize health, education, and gender equality. High adolescent fertility rates can hinder progress in these areas by affecting education completion rates for young women and impacting their health and economic prospects.
To address these complex issues, data-driven strategies are essential. Promoting comprehensive sexual education, enhancing healthcare access, and empowering young women with choices can lead to healthier societies and further progress in reducing birth rates in line with our sustainable development aspirations.
As we analyze these visuals, we’re reminded of the power of data to shape our understanding and our actions. Let’s use these insights to foster a world where every young person is equipped with the knowledge and resources to make informed decisions about their reproductive health.
by gne05 | Nov 18, 2023 | Uncategorized
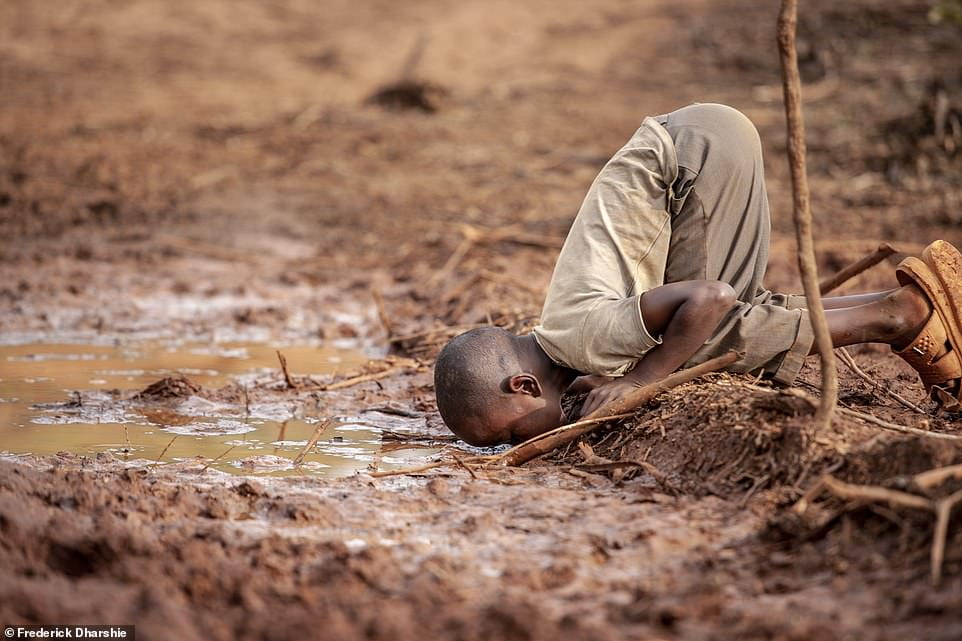
African countries face a critical water situation, with millions lacking access to clean and safe water sources
According to the United Nations, about 40% of the world’s population lack access to the least basic water needs and with the global temperatures on the rise this number is expected to further increase. In line with its vision for the year 2030, the United Nations is developing a series of targets such as eliminating water sources pollution and increasing international cooperation, however until today not much has done to ensure that this goal will be met by year 2030.
African countries have the highest mortality rates related to unsafe water sanitation
As shown in the above heatmap, the highest mortality rates related to unsafe water in year 2019 belonged to countries from the African continent solely with Lesotho and Chad leading the way with 108.1 and 99.2 deaths coming from unsafe water sources respectively. In addition, as displayed in the above map, the African continent is clearly in a critical situation with less than half of the population receiving access to basic water services in most of its countries.
Increasing international cooperation can improve the African water situation
To address the critical water situation, a multifaceted solution involves improving water infrastructure, implementing sustainable water management practices, raise awareness and avoid water pollution. However, as known for its weak economic situation, most of the African countries are not currently capable to develop such infrastructural expansions, highlighting the need of an international cooperation to solve the critical water situation in Africa.
Integrated programs can scale and validate the proposed solutions to solve the current situation
Series of programs led and initiated by international partners can be used to assess the feasibility and effectiveness of the proposed solutions, including the sustainable water usage and pollution control to restore the ecosystems in Africa and ensure that the whole population is receiving access to the least basic water services. In addition, the programs will ensure the global collaboration discussed above.
All stakeholders should proceed immediately
As mentioned above, the United nation clearly stated that much has to be done to be in line with the SDG goals of year 2030. In this regard, we recommended to focus on clear policies that call for an immediate action plan to ensure those goals. But most importantly, we recommend all stakeholders to proceed immediately as the African continent is in a desperate water situation while mortality rates are going through the roof.
For more info, read the following articles:
https://www.unep.org/explore-topics/sustainable-development-goals/why-do-sustainable-development-goals-matter/goal-6
https://education.nationalgeographic.org/resource/sustainable-development-goal-6-clean-water-and-sanitation/
https://www.unwater.org/sites/default/files/2023-08/UN-Water_SDG6_SynthesisReport_2023.pdf
#SDG #SDG6 #Africa #Water #WaterSanity #Danger #Resources #HumanRights #UnitedNations #UN #Equality #UNEP #UNWater