The digital environment in Lebanon is now as important as the physical one. Whether it’s students attending online classes, businesses relying on cloud tools, or families staying connected, internet access today is a basic necessity and not a luxury.
However, just like Lebanon’s infrastructure, internet access is not equal throughout districts. Some regions enjoy strong, stable connections, while others lag far behind, struggling with unreliable or limited access.
In order to determine which districts in Lebanon are underserved and which are setting the standard for digital access, this visualization examines the availability of internet services throughout the country.
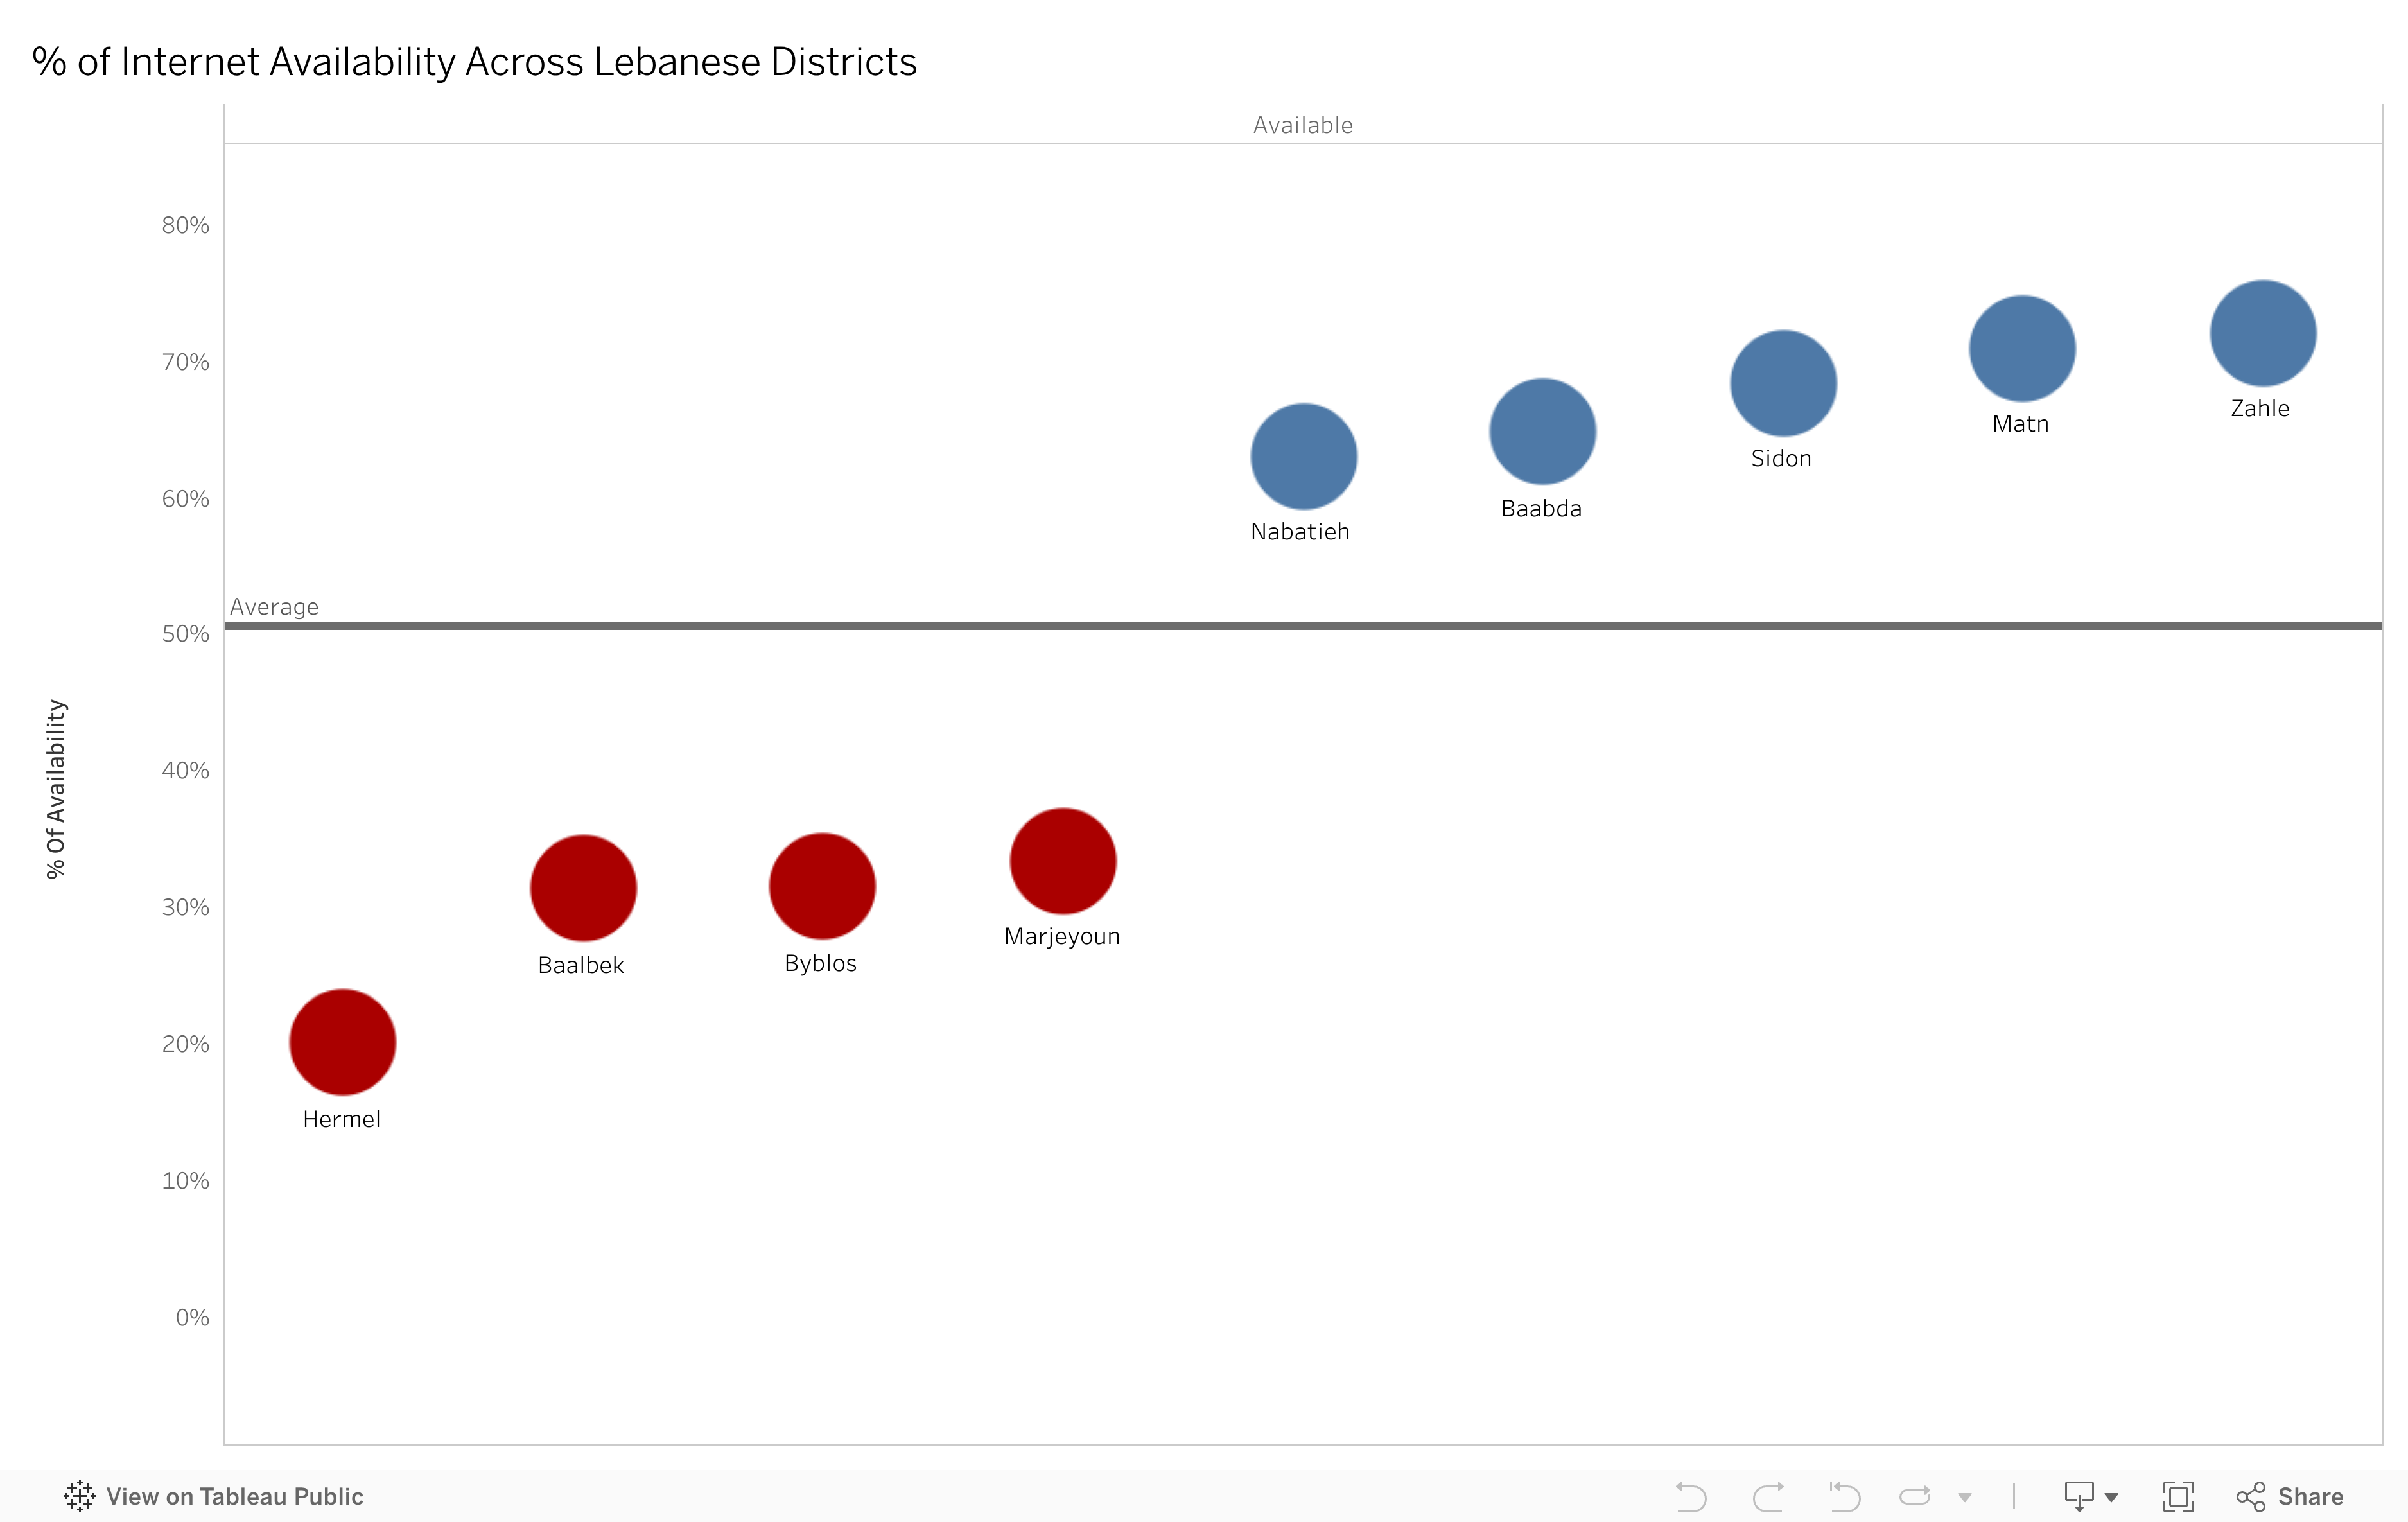
Scatter Plot – Internet Availability by District : This scatter plot demonstrates each district’s percentage of available internet, with respect to the national average line. Blue dots reflect districts above average availability and districts with below-average availability are shown by red dots. This makes it easier for us to quickly determine who is leading and who is having difficulty.
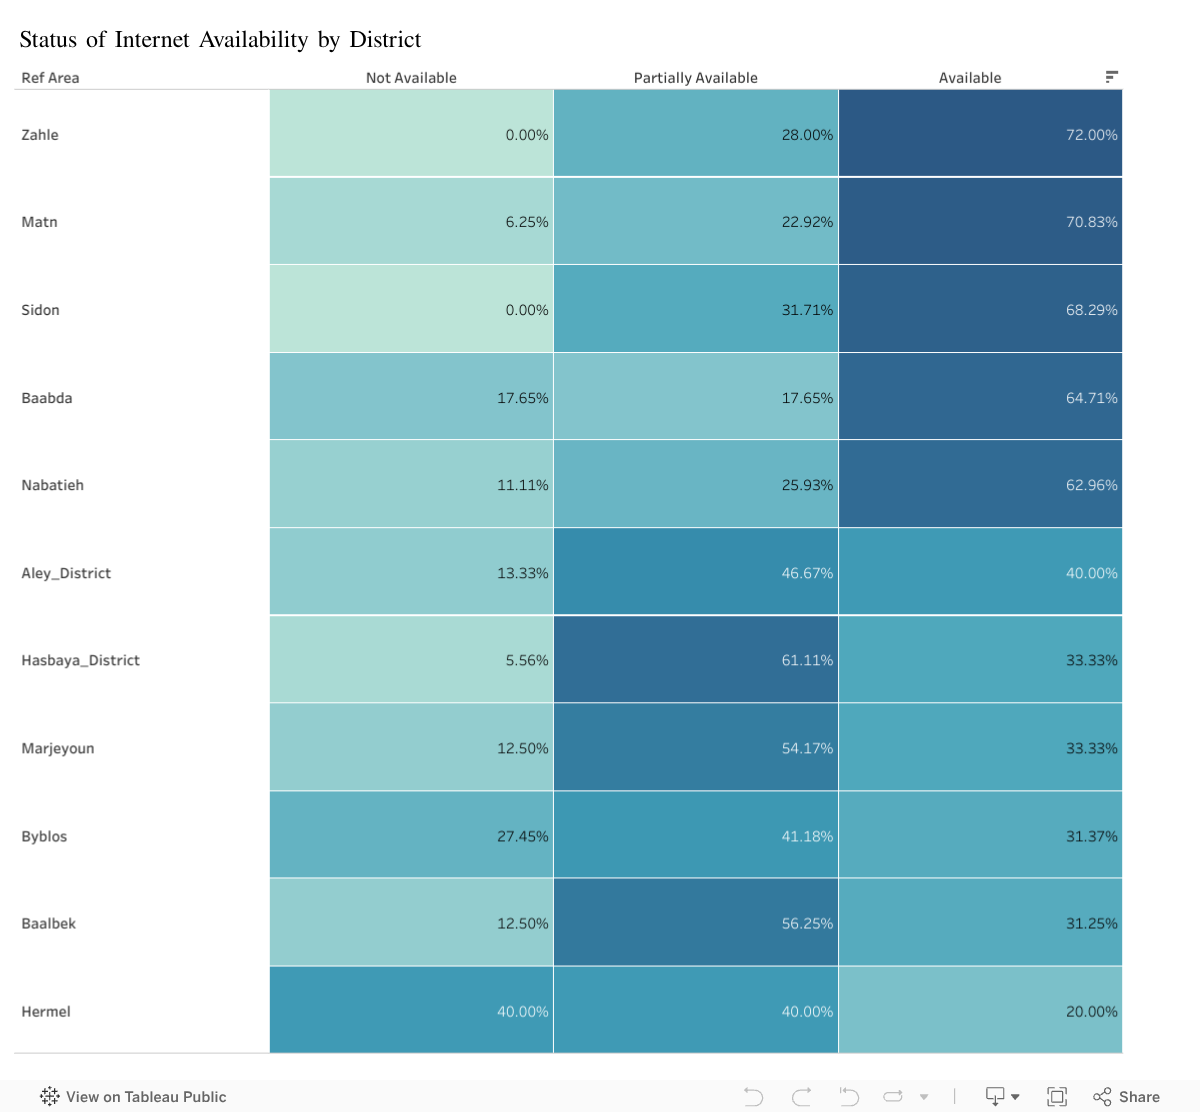
Heatmap – Full Breakdown of Internet Status : The distribution of each district is shown on the heatmap across (Not Available, Partially Available, Available). This provides a broader perspective, showing not just the amount of internet that is available but also the amount that is unstable or unavailable.
The two images together provide a complete picture of the digital divide in Lebanon.
Key Insights
Zahle and Matn Lead the Country Districts like Zahle, Matn, Sidon, and Baabda show the highest levels of internet availability, reaching 68 – 72%.
This indicates that these regions are Lebanon’s most digitally accessible areas where there’s a crucial advantage for education, business, and services.
A Significant Gap in Underserved Districts Districts like Hermel, Baalbek, Byblos, Marjeyoun fall well below the national average with availability rates around 20 – 33%. Which indicates that these areas still face major barriers to connectivity that is affecting economic activity, education, and access to online services.
Partially Available is completely the opposite of Reliable The percentage of “Partially Available” internet is unexpectedly high in a few of districts.
This indicates that although the service is available, it is unstable or inconsistent, resulting in another kind of inequality where people have access to it but it isn’t reliable enough for everyday needs.
Why This Matters
Internet access is now tied to:
Educational opportunities
Business growth
Access to digital government services
Healthcare communication
Social inclusion
Regions with poor connectivity risk falling further behind which will increase the gap in economic and social inequalities. Internet infrastructure directly shapes a region’s ability to participate in the digital economy.
A Call for Digital Equity Lebanon needs fair internet, not just faster internet. This visualization highlights where investment is most needed. Increasing internet accessibility in poorer regions can benefit students, small enterprises, open doors, and reduce regional disparity.
Thousands of students in Lebanon are underserved by the concentration of educational opportunities in a small number of governorates. Policymakers must make investments in areas that lack public branches, colleges, and educational resources in order to create a more inclusive future.
1. A Landscape of Uneven Learning Opportunities
Lebanon’s education system has long been viewed as a regional strength but this strength is not evenly distributed. By mapping universities, Lebanese University (LU) branches, and the availability of educational resources across governorates, a clear pattern emerges: a select few governorates enjoy strong coverage, while others have limited or almost no access.
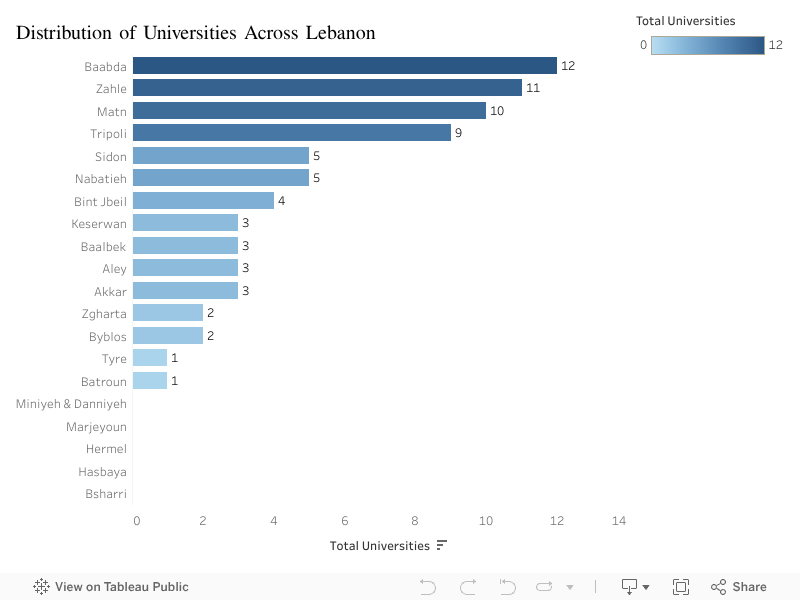
The visualization shows that:
Baabda, Zahle, and Matn dominate in the number of universities.
Meanwhile, areas like Bsharri, Batroun, Hermel, and Hasbaya have only 1 or zero universities.
This imbalance shapes future opportunities. Where a student is born should not determine how far they can go but right now, it often does.
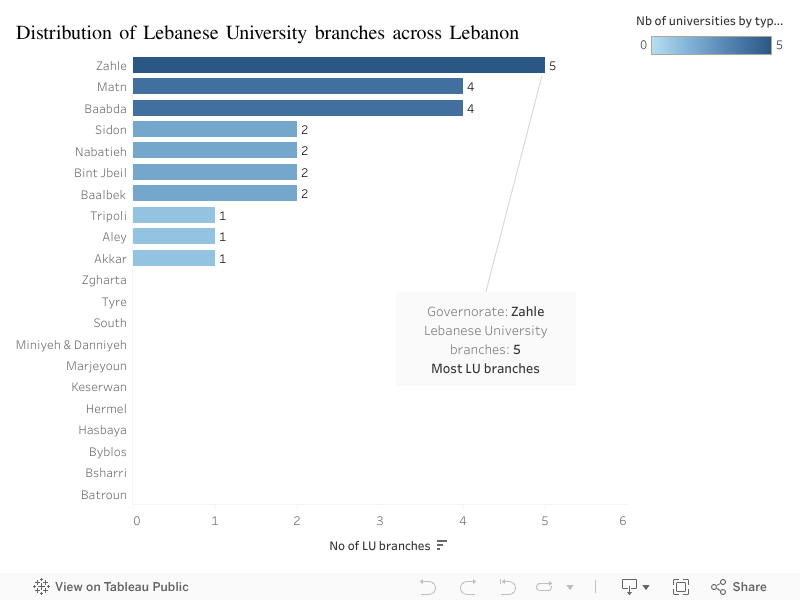
2. Public Higher Education Is Even More Concentrated
Access to affordable education is even more unequal.
Zahle and Matn lead with 5 and 4 LU branches.
Many areas including Tyre, Akkar, Zgharta, Hasbaya, Hermel have one or no branches.
Several governorates have none at all, forcing students to relocate or drop out.
This reinforces a cycle: private universities cluster in the center, while public universities remain scarce outside major cities.
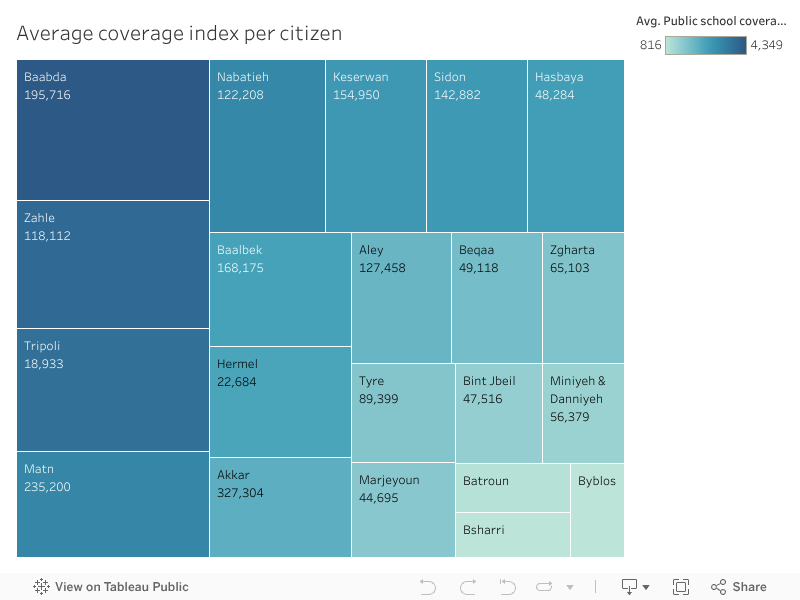
3. The Coverage Index: How Many Citizens Each University Serves?
To measure real accessibility, the coverage index compares each region’s population to the number of universities available.
Here the gap becomes dramatic:
In Baabda and Matn, one university serves fewer than 200,000 people.
In Hermel, Bsharri, and Tripoli, a single university covers more than 300,000 residents.
The message is clear: some regions are overserved, while others are severely underserved.
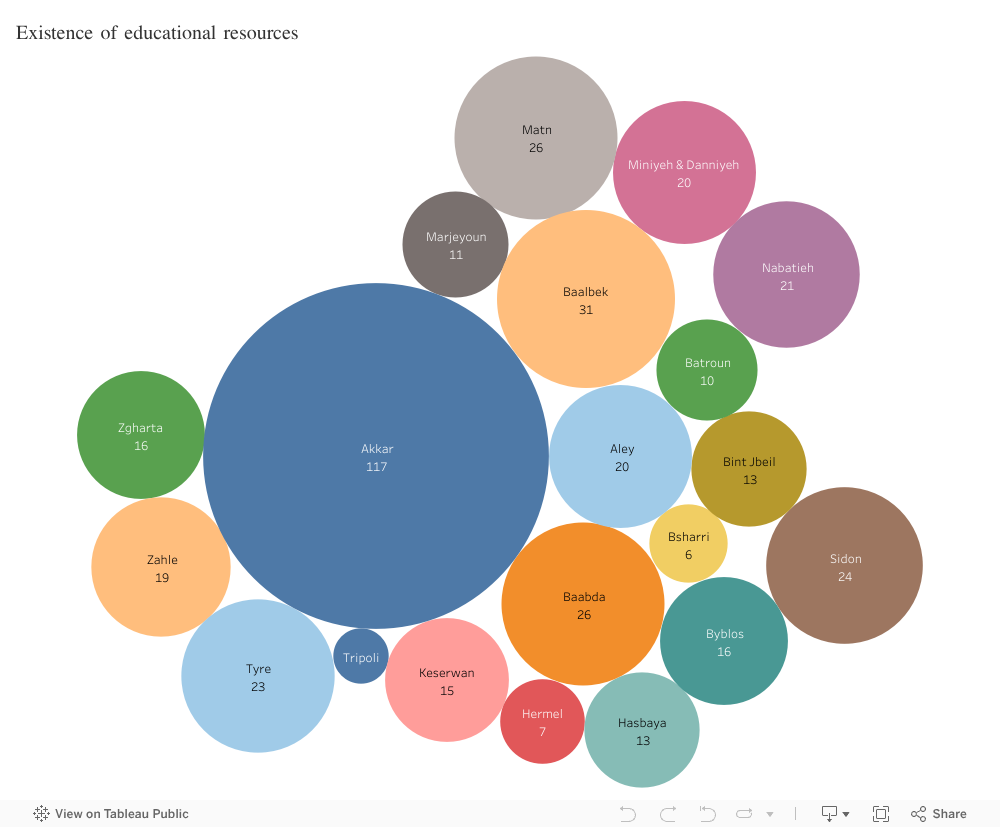
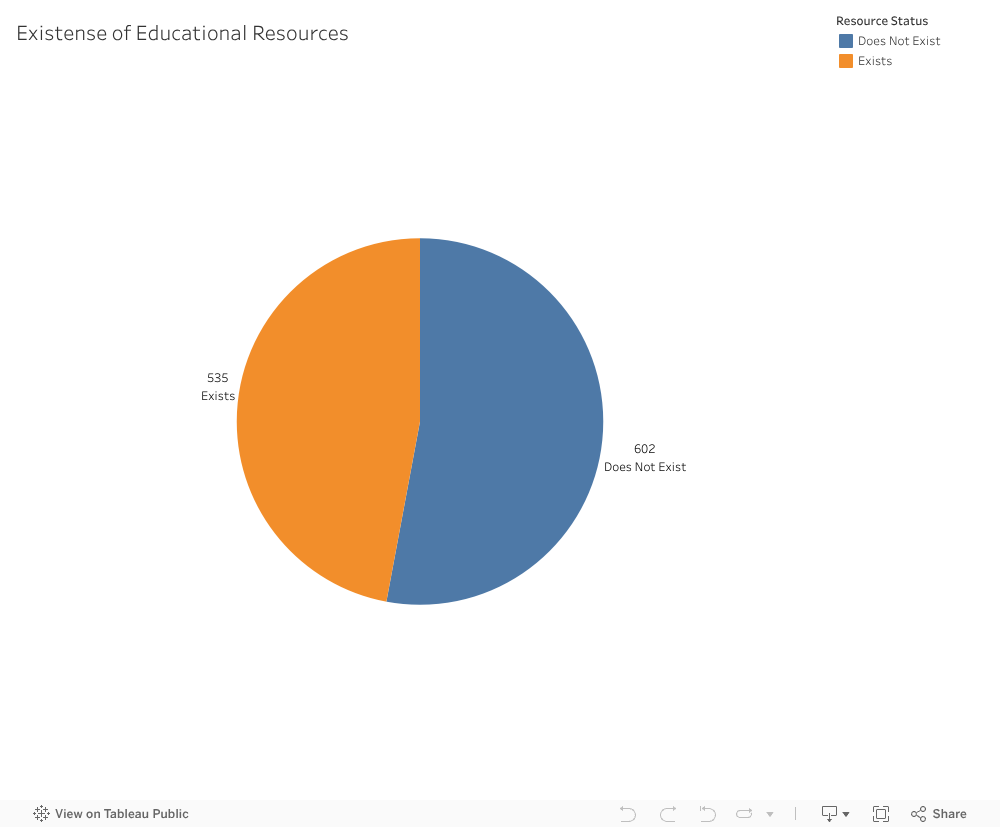
4. Do Educational Resources Exist Where They’re Needed Most?
When we look at the distribution of educational resources—libraries, cultural centers, labs, and learning facilities another pattern emerges:
Akkar, Baalbek, and Baabda have the highest counts.
Remote districts like Bsharri, Hermel, Batroun, and Marjeyoun have almost none.
This highlights a critical insight: some areas have the right infrastructure but lack universities, while others have universities but no supporting learning ecosystem.
5. What This Means for Lebanon
Lebanon’s most significant educational challenge is not quality but fairness. The maps reveal a structural inequality that affects:
university enrollment
student mobility
long-term employment opportunities
economic development in rural areas
By investing in the regions with the lowest coverage and resource availability, Lebanon can create a more inclusive and productive society.
Call to Action
We recommend a targeted educational investment plan for underserved governorates, focusing on:
Opening new LU branches in areas with zero public presence
Strengthening educational resources where population density is high
Supporting private institutions willing to expand beyond major districts
Digital learning infrastructure for remote areas
Education shouldn’t depend on geography. With intentional planning, it doesn’t have to.
In the high-stakes world of real estate and tourism investment, there is a prevailing feeling that the map has already been drawn. We are constantly told that the “smart money” has already moved, that the best locations are taken, and that finding a new opportunity means fighting for scraps in saturated markets. When we look at the industry, we usually see two things: expensive, crowded success stories, or underdeveloped ghost towns that no one wants to visit.
But sometimes, if you look at the data differently, the map changes.
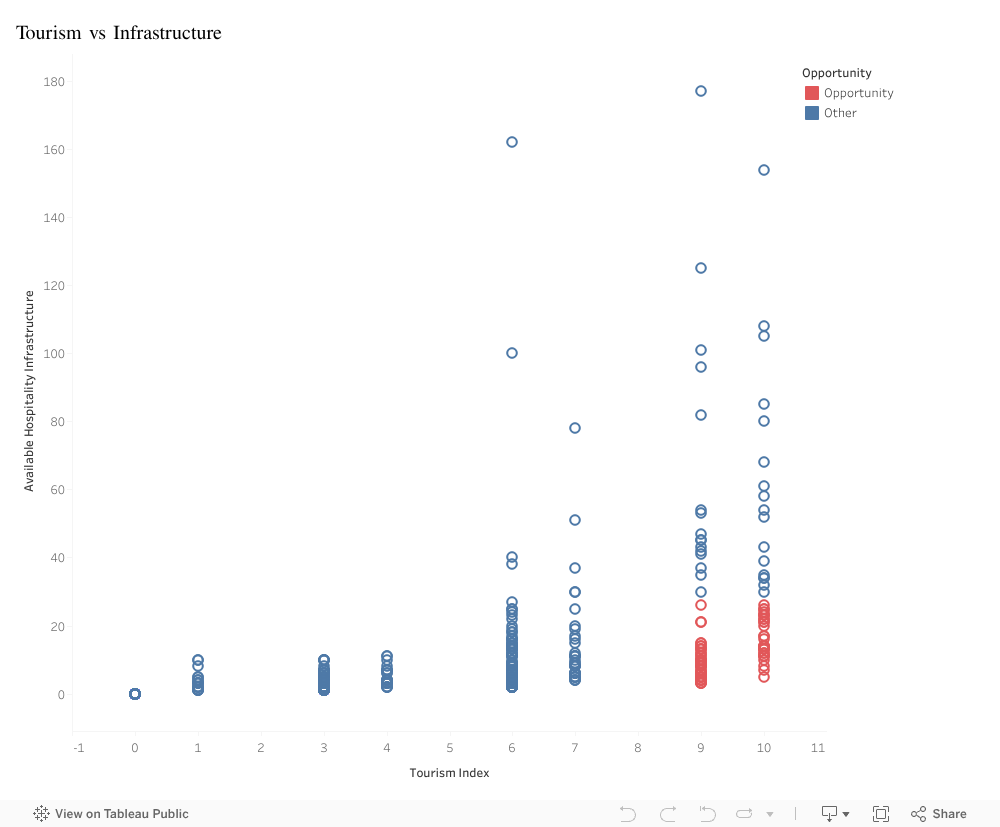
In this visualization, I analyzed the relationship between two critical factors: the Tourism Index (the raw, magnetic appeal of a destination, from natural wonders to historical sites) and Available Hospitality Infrastructure (the actual supply of hotels, restaurants, and services).
At first glance, the sea of blue dots confirms the traditional idea. The data follows a predictable, efficient path. In the top right, you see the famous destinations: high appeal matched by high infrastructure. These are successful, but they are also a dangerous gamble; expensive to enter and fiercely competitive. In the bottom left, you see the opposite: low appeal and low infrastructure. No surprise there.
But as you scan the bottom right of the chart, the pattern fractures.
This is where the red dots appear, and they tell a completely different story. These data points represent towns with a Tourism Index of 9 or 10, world-class destinations that tourists are desperate to visit. Yet, their infrastructure bars are effectively at zero.
This gap represents a massive market failure, and for an investor, a market failure is a goldmine.
These aren’t towns that need marketing; they are towns that need capacity. The demand is already there, waiting for someone to unlock it. By ignoring the crowded top-right corner and focusing on this specific cluster, investors can bypass competition entirely. Building here means you aren’t just another hotel in a crowded city; you are the hotel in a destination people are already fighting to see.
Big Idea
The data reveals a rare and profitable anomaly: a specific cluster of towns with world-class tourist demand but near-zero infrastructure. Investors should pivot away from saturated markets and target these “red dot” locations to secure a first-mover advantage in destinations where demand drastically outstrips supply.
How would you feel if a loved one fell ill from something as preventable as contaminated water or food? For thousands of Lebanese families, this isn’t a hypothetical question. It’s a reality repeated every year.
Between 2015 and 2023, Lebanon has battled three persistent infectious diseases: Food Poisoning, Typhoid Fever, and Viral Hepatitis A. But what the data reveals is not just infection. It’s inequality. Some regions, especially the North and Beqaa, report recurring outbreaks, while others seem untouched. The truth is not that these diseases vanish across borders, but that our systems fail to capture them equally.
Our team’s dashboard brings these hidden patterns to light. By combining national surveillance data across time, region, and age, we uncovered how outbreaks intensified after 2020–particularly Hepatitis A, which surged sharply in the North. Children and teenagers (0–19 years) bear the greatest burden, showing that the threat targets Lebanon’s youngest and most vulnerable.
But this isn’t just a story of data; it’s a call to action. Interactive (and more sophisticated dashboards) can serve as early-warning systems, alerting public-health officers when abnormal spikes occur and guiding timely interventions such as water testing, vaccination campaigns, or food-safety inspections. When paired with awareness programs in schools and clinics, data becomes protection.
Lebanon has the expertise. What it needs now is integration. A living, public, and transparent system that keeps health information flowing as fast as disease itself, in hopes that, in those times when everyone can see the pattern, everyone will be able to act on it.
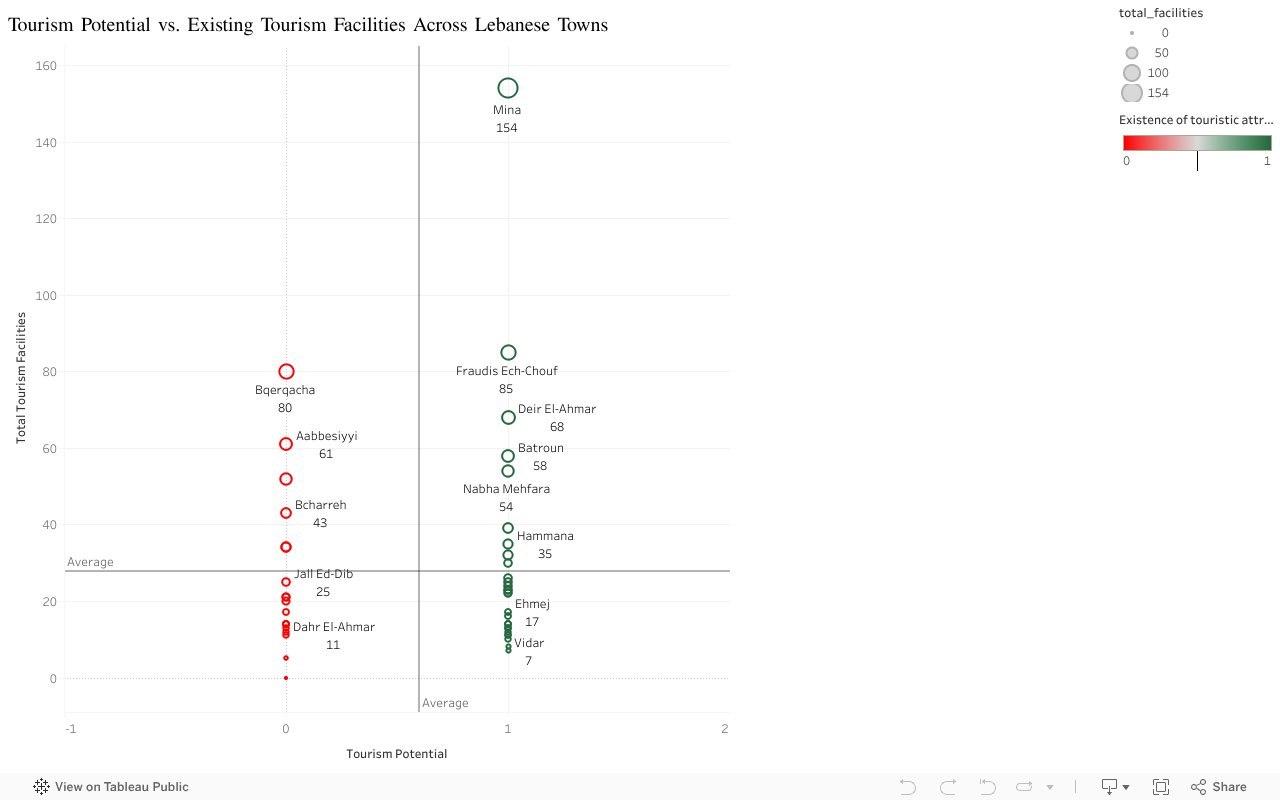
Lebanon is a country with immense tourism potential, boasting rich culture, stunning landscapes, and historical sites. However, not all towns are benefiting equally from this potential. This visualization compares tourism potential to existing tourism infrastructure across Lebanese towns, highlighting areas where growth could be nurtured and where existing facilities are already making an impact.
Lebanon’s tourism sector plays a vital role in its economy, offering opportunities for job creation, cultural exchange, and local development. However, many regions are underperforming in terms of tourism development, failing to fully capitalize on their natural and cultural assets. This post delves into the disparity between tourism potential and existing tourism facilities across Lebanon’s towns.
Using a visualization that compares the number of tourism facilities to their respective tourism potential, we aim to identify regions that could benefit from additional investment and infrastructure development.
What Does the Data Tell Us?
This visualization plots each Lebanese town based on two key factors:
Tourism Potential: A measure of the town’s attractiveness for tourism, considering factors like natural beauty, cultural significance, and historical sites.
Existing Facilities: The number of established tourism-related services such as hotels, restaurants, and attractions available to tourists.
By comparing these two aspects, we gain insights into which towns are thriving and which ones are still underdeveloped in terms of tourism infrastructure.
Key Insights:
Mina: The Top Performer
Mina emerges as the clear leader, with a remarkable tourism potential score of 154, accompanied by 80 existing facilities. This combination makes Mina a strong hub for tourism in Lebanon, ready to attract and serve visitors effectively.
Underserved Towns with High Potential:
Some towns show a significant gap between their tourism potential and the number of available facilities. For instance, Aabeyssi (potential score: 61) and Baalbek (potential score: 52) have good tourism prospects but still lack sufficient infrastructure to meet demand. Investment in these towns could lead to substantial growth in Lebanon’s tourism sector.
The Struggling Towns:
At the other end of the spectrum, towns like Aarsfiq (with a potential score of only 5) show a clear lack of infrastructure and limited tourism prospects. These regions face challenges in attracting visitors without significant investment and development in tourism services.
Towns With Balanced Growth:
Towns such as Fraudis Ech-Chouf and Deir El Ahmar are performing reasonably well, having both a decent number of facilities and moderate tourism potential. These towns can build on their existing foundations to enhance their tourism offerings further.
Conclusion:
The gap between tourism potential and existing facilities across Lebanese towns presents both challenges and opportunities. While some towns are already strong players in the tourism sector, others have untapped potential waiting to be unlocked with the right investments in infrastructure and tourism services.
By addressing these disparities, Lebanon can ensure that more regions share in the benefits of tourism, fostering economic growth and preserving the rich cultural heritage of the country.
Call to Action:
Local municipalities and private investors can use this data to identify key areas where tourism facilities need improvement. With strategic planning, these towns could transform into major tourism destinations in Lebanon, contributing to the country’s broader economic recovery and development.
Despite major progress in education over the last 70 years, gender inequality still defines Lebanon’s labor market. This blog explores why education alone isn’t enough to close the workforce gap and offers actionable insights for change.
Read on for more
Lebanon’s educated women are being left behind
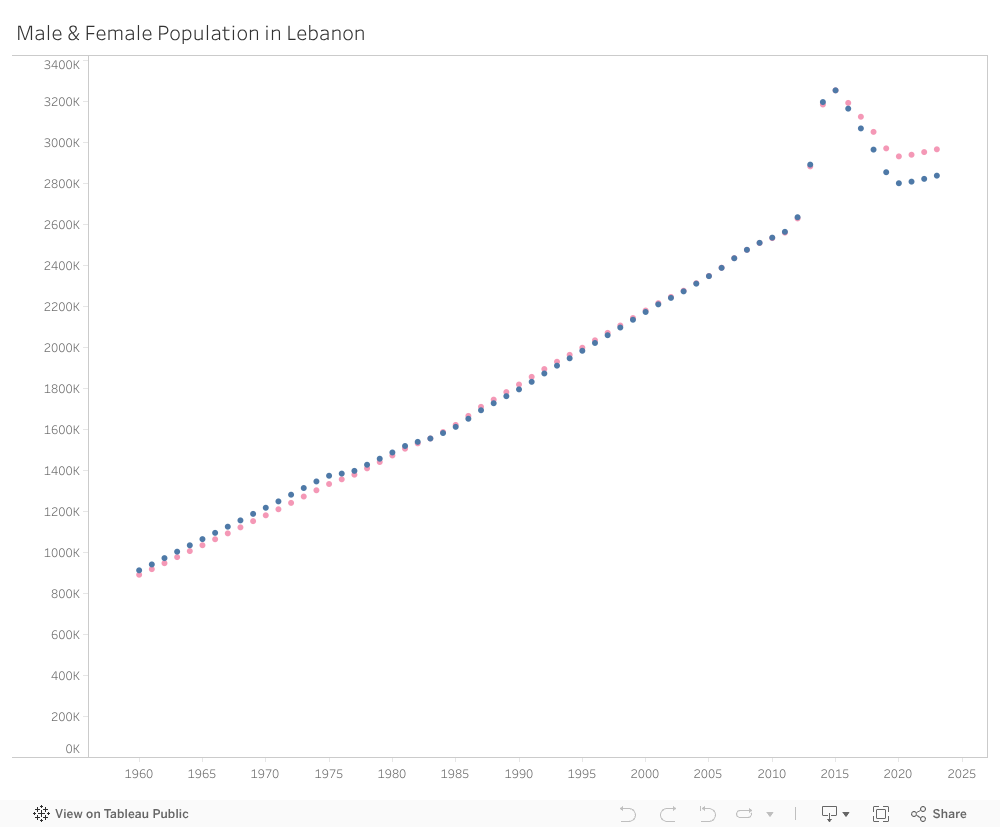
Despite a stable growth in academic achievements and near-equal populations between Lebanese males and females, there continues to be significant underrepresentation of women in the labor force.
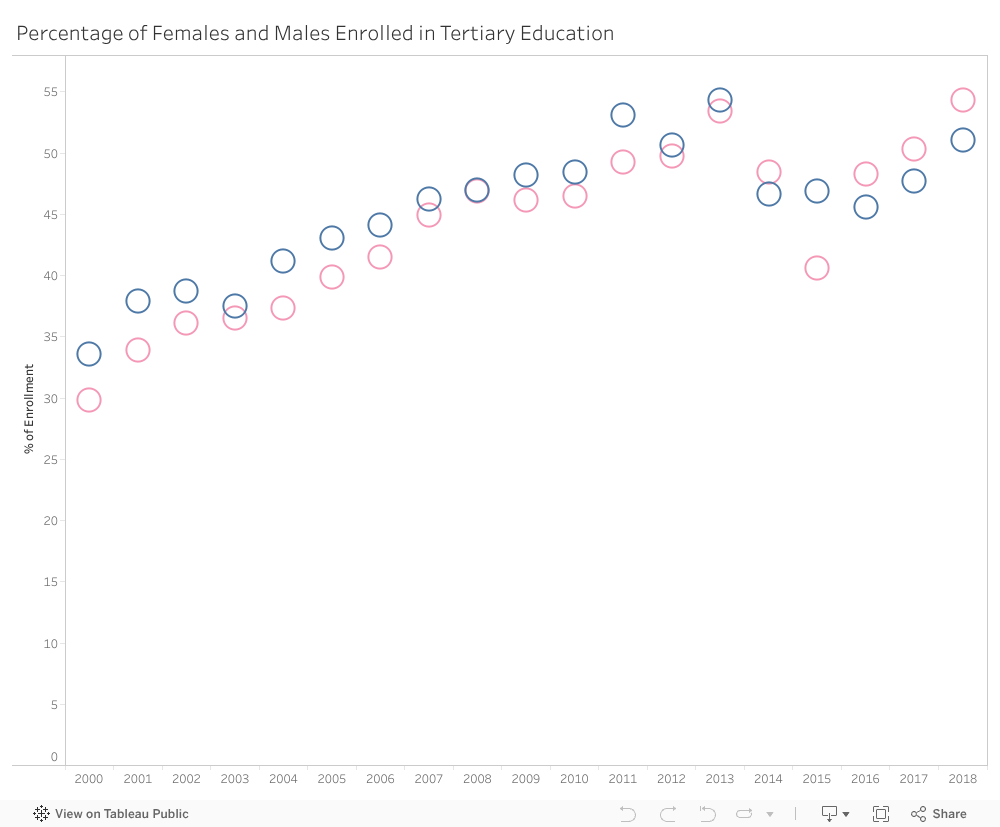
This chart illustrates the distribution of Lebanese males and females over the years.
The Gender Divide in Numbers
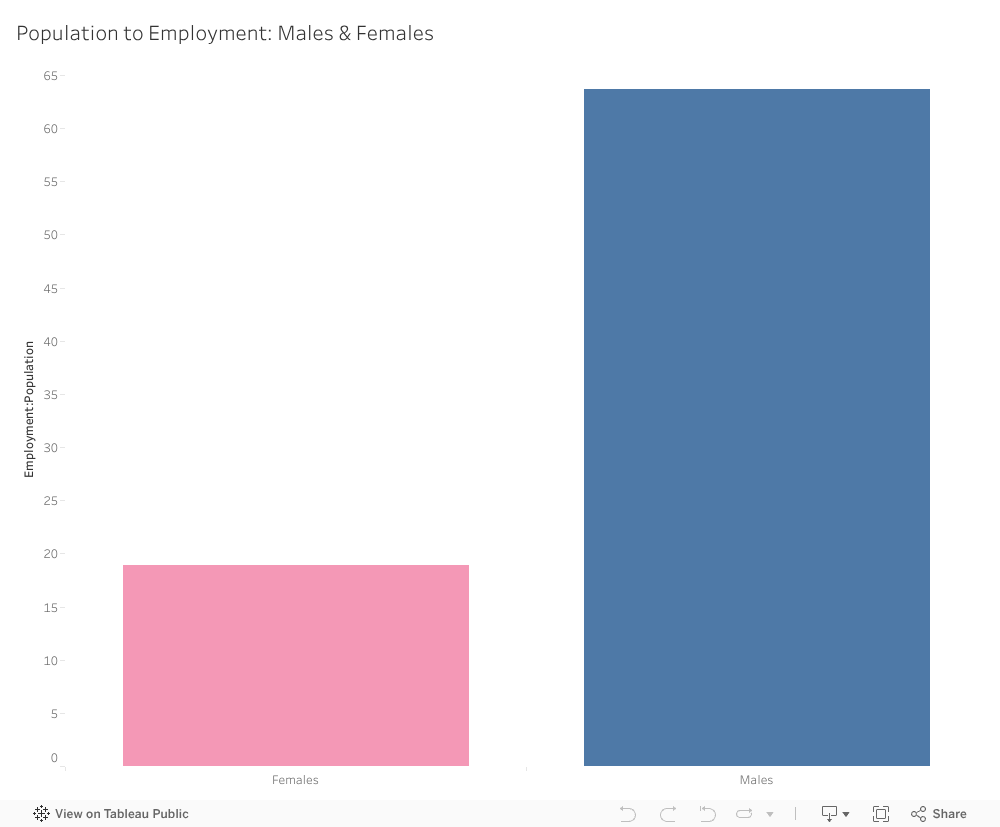
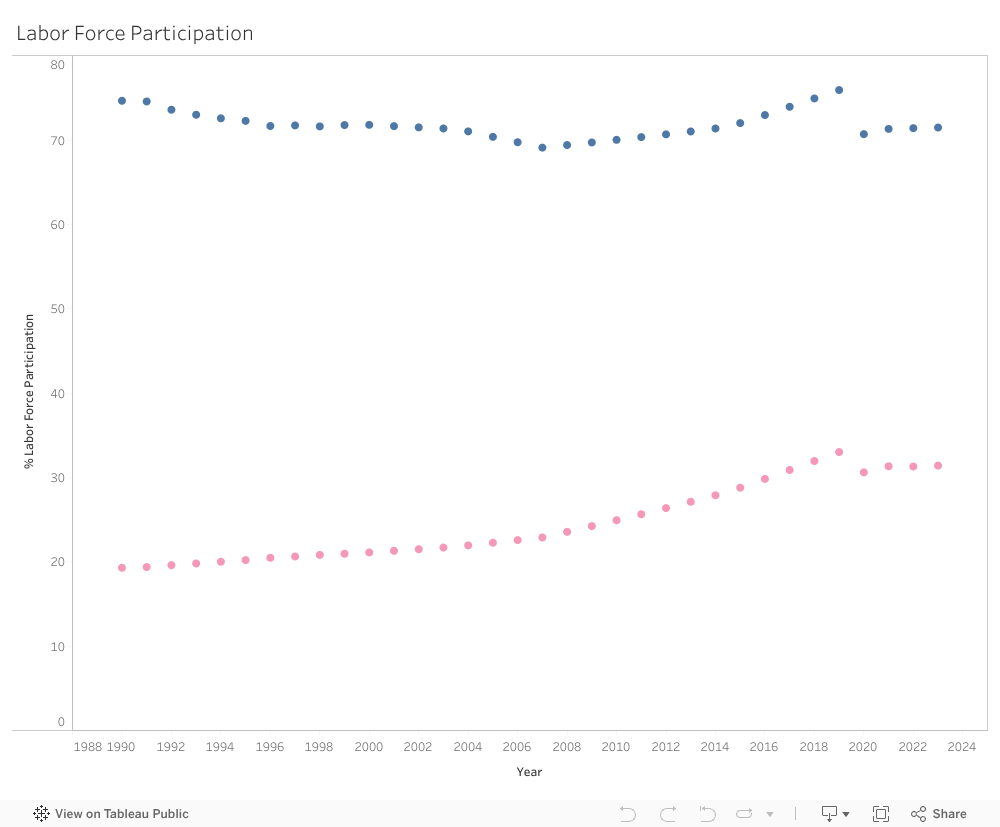
Although Lebanon is doing well in terms of gender education equality, a large gap persists in the labor market. Since 2015, women have surpassed men in attaining tertiary education, yet their workforce participation remains quite low. The labor force participation chart displays a persistent divide as female involvement is consistently lagging behind males. In this case, the lag is not due to population differences either as they are nearly equal over time but diverge slightly in 2016 with a higher female: male ratio ever since. To further confirm this, the employment-to-population ratio pie chart shows a striking difference where men dominate the workforce by nearly 45% despite women’s growing educational attainment.
The bar chart below shows a striking gender gap in the labor force participation, despite growing educational attainment by women.
Now we see a clearer breakdown of male-to-female participation in the workforce over time, emphasizing how, despite education equality, the gender gap in employment persists.
Where do we go from here?
Lebanon has successfully achieved gender equality in education; now, it’s time to focus on ensuring women have equal opportunities in the workforce. The solution isn’t to just hire more women; Lebanon must implement more programs that prepare women for the job market and levelling the playing field between male and female professionals.
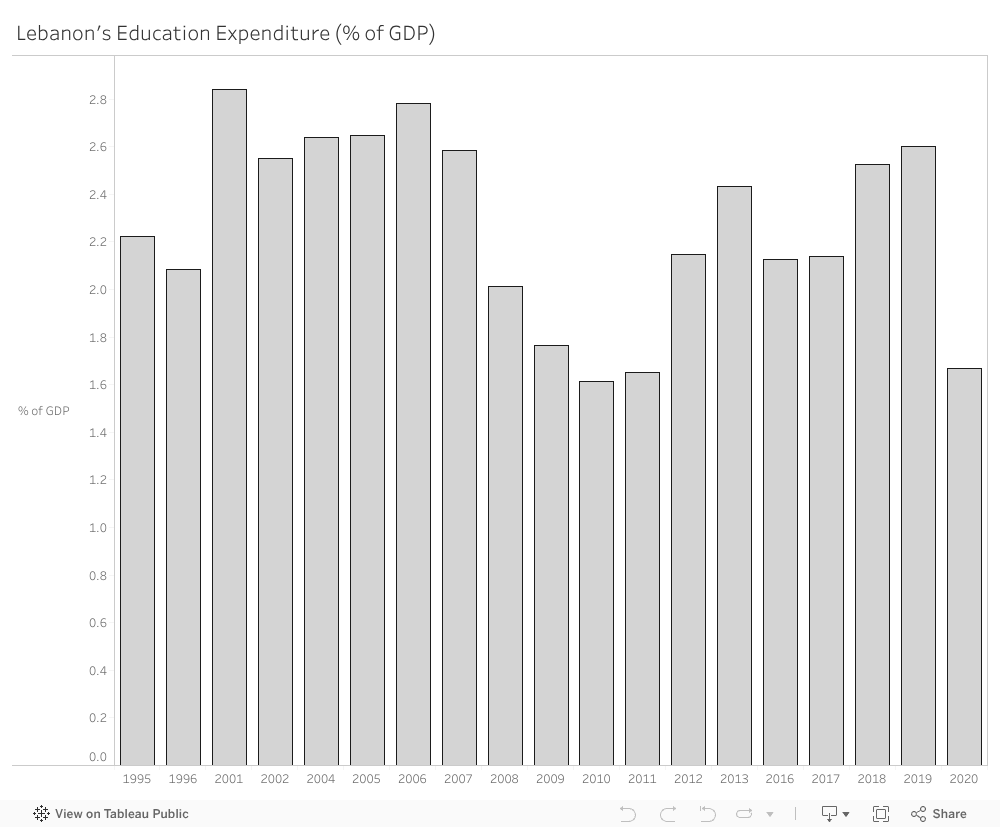
Lebanon should re-evaluate their investment in education as its spending as a percentage of the GDP has been stagnant for years, only peaking in 2011 at 2.84%.
Leveling the Playing Field
Broader systemic barriers also create an unnoticeable cause & effect cycle which needs to be addressed by various institutions to help solve this issue. Academic achievement is at the core of solving these problems where meritocracy reigns alongside equal opportunities. Workplaces need to reform by implementing gender-sensitive hiring practices, promoting transparency in pay and leadership opportunities, and crafting mentorship programs that guide female graduates into long-term careers. From a wider perspective, expanding access to affordable childcare and flexible work structures would give women a choice whether they want to work or not. Lastly, it is crucial to raise public campaigns aimed at shifting societal norms and reframe women’s economic participation as not just a gender issue, but a national growth imperative.
This graph shows the women have outpaced men in tertiary education, reinforcing the argument that education is not the issue.
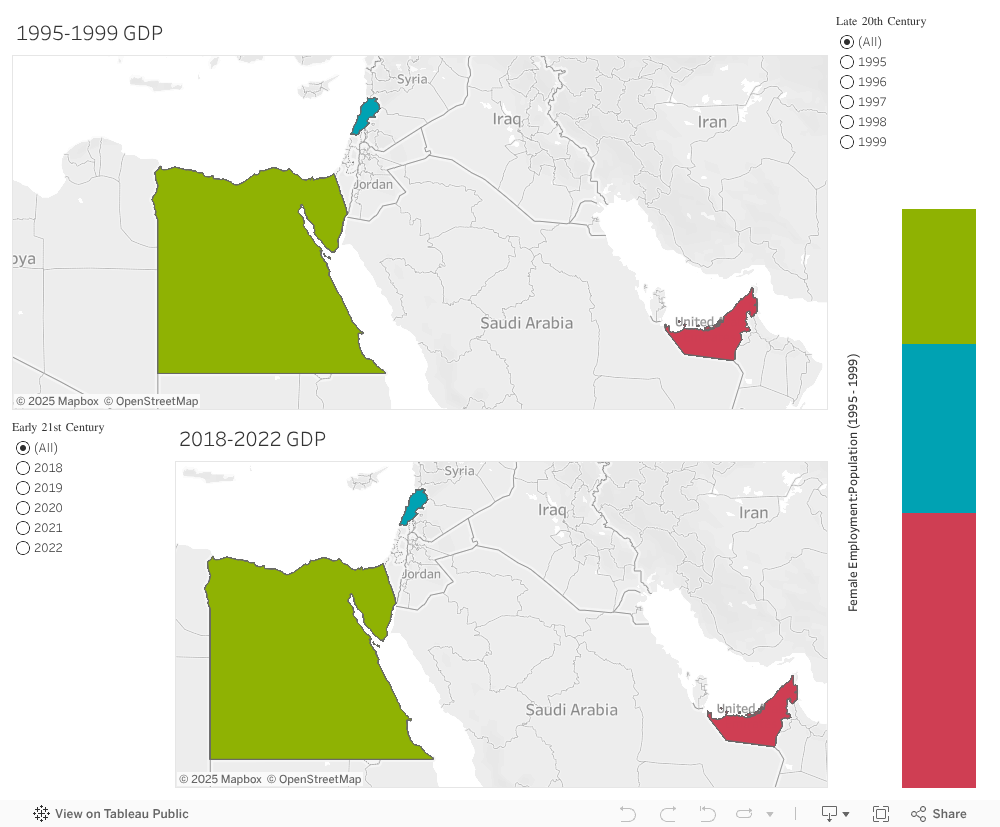
Lessons from the Region
According to the World Bank, closing gender gaps in the workforce could boost the GDP of MENA countries by up to 47%. Both the United Arab Emirates and Egypt proved this to be true as their respective GDP’s rose by 12% and 34% with the contribution of women in the workforce. For Lebanon, where talent can go unnoticed due to a multitude of reasons, empowering women to fully participate in the economy is financially strategic and has been long overdue.
Translating Education into Opportunity
Lebanon has made remarkable strides in women’s access to higher education. The challenge remains in translating this educational success into tangible career opportunities. Some strong recommendations to address this problem efficiently are as follows:
1- Collaborate with NGO’s, Members of Parliament, and the private sector to design inclusive policies,
2- Build career pipelines that bridge the gap between education and employment,
3- Incorporate gender audits into hiring processes to ensure fairness and meritocracy,
4- Introduce gender-sensitive mentorship programs to guide female graduates,
5- Advocate for systemic reforms that provide women with better access to affordable childcare and flexible work-arrangements.
Our Shared Responsibility
Only through a coordinated, shared commitment can Lebanon turn educational success into economic empowerment, building a future where every citizen, regardless of gender, has the opportunity to contribute to national growth.