Cryptocurrency: Deceptive or Revolutionary:

If you grew up in the late 90s or early 2000s like I did, you probably remember the sound of dial-up internet, the first Nokia phones, and the excitement of discovering something new online every day.
Back then, the idea of a “digital currency” felt like science fiction, the kind of thing we’d joke about on MSN Messenger.
But in 2008, a mysterious person named Satoshi Nakamoto dropped the Bitcoin white paper, and by January 2009, Bitcoin came to life. No banks. No government. Just code, hope, and a new way of thinking about money.
I didn’t understand it at first, so I kept reading. That’s also when I learned about the Bitcoin halving, a built-in event every four years that cuts the new supply in half.
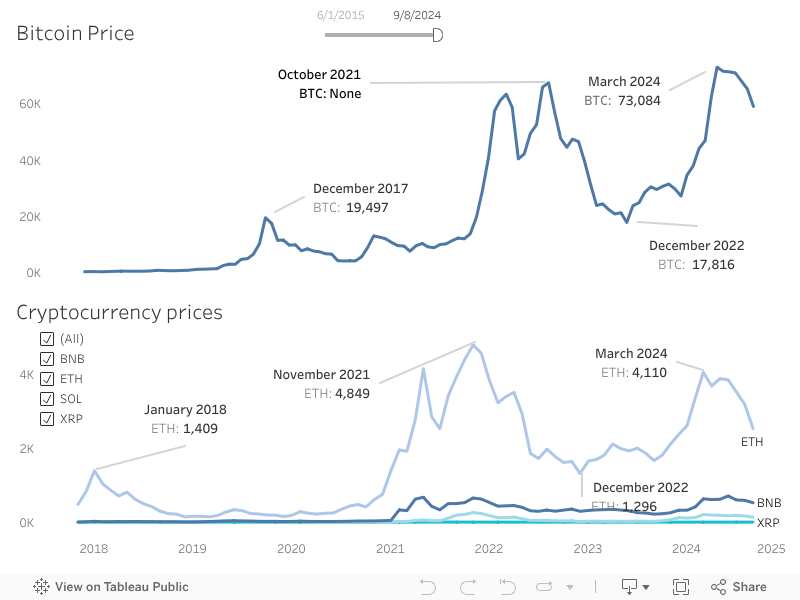
The halvings in 2012, 2016, 2020, and 2024 each played a huge role in Bitcoin’s price, almost like a heartbeat that keeps the market alive.
Soon the crypto universe expanded.
XRP came in 2012, Ethereum in 2015, BNB in 2017, and Solana in 2020.
Each one brought something different, and suddenly crypto didn’t feel like a joke anymore, it felt like the future.
Back then, people believed crypto lived outside the real world, like a safe haven where governments couldn’t interfere.
But life has a way of proving us wrong.
March 2020: the Covid crash:
I still remember watching the charts that week.
Bitcoin fell from around $9,000 to below $5,000. Ethereum dropped, and BNB, XRP, and even the newborn Solana were hit hard.
It didn’t matter that the Bitcoin halving was just weeks away, fear was stronger.
2018-2019: U.S.-China economic war:
I used to think crypto was immune to politics.
But during the trade tensions, Bitcoin collapsed from $19K to under $4K, and Ethereum slipped under $100. Every other coin blindly followed.
November 2022: The FTX disaster
This one felt personal.
FTX was everywhere: ads, influencers, celebrities. Everyone trusted it. Then suddenly, in a single month, it collapsed.
Bitcoin fell below $16K. Solana lost more than 60%. ETH, XRP, and BNB prices all fell down.
That’s when I understood the truth:
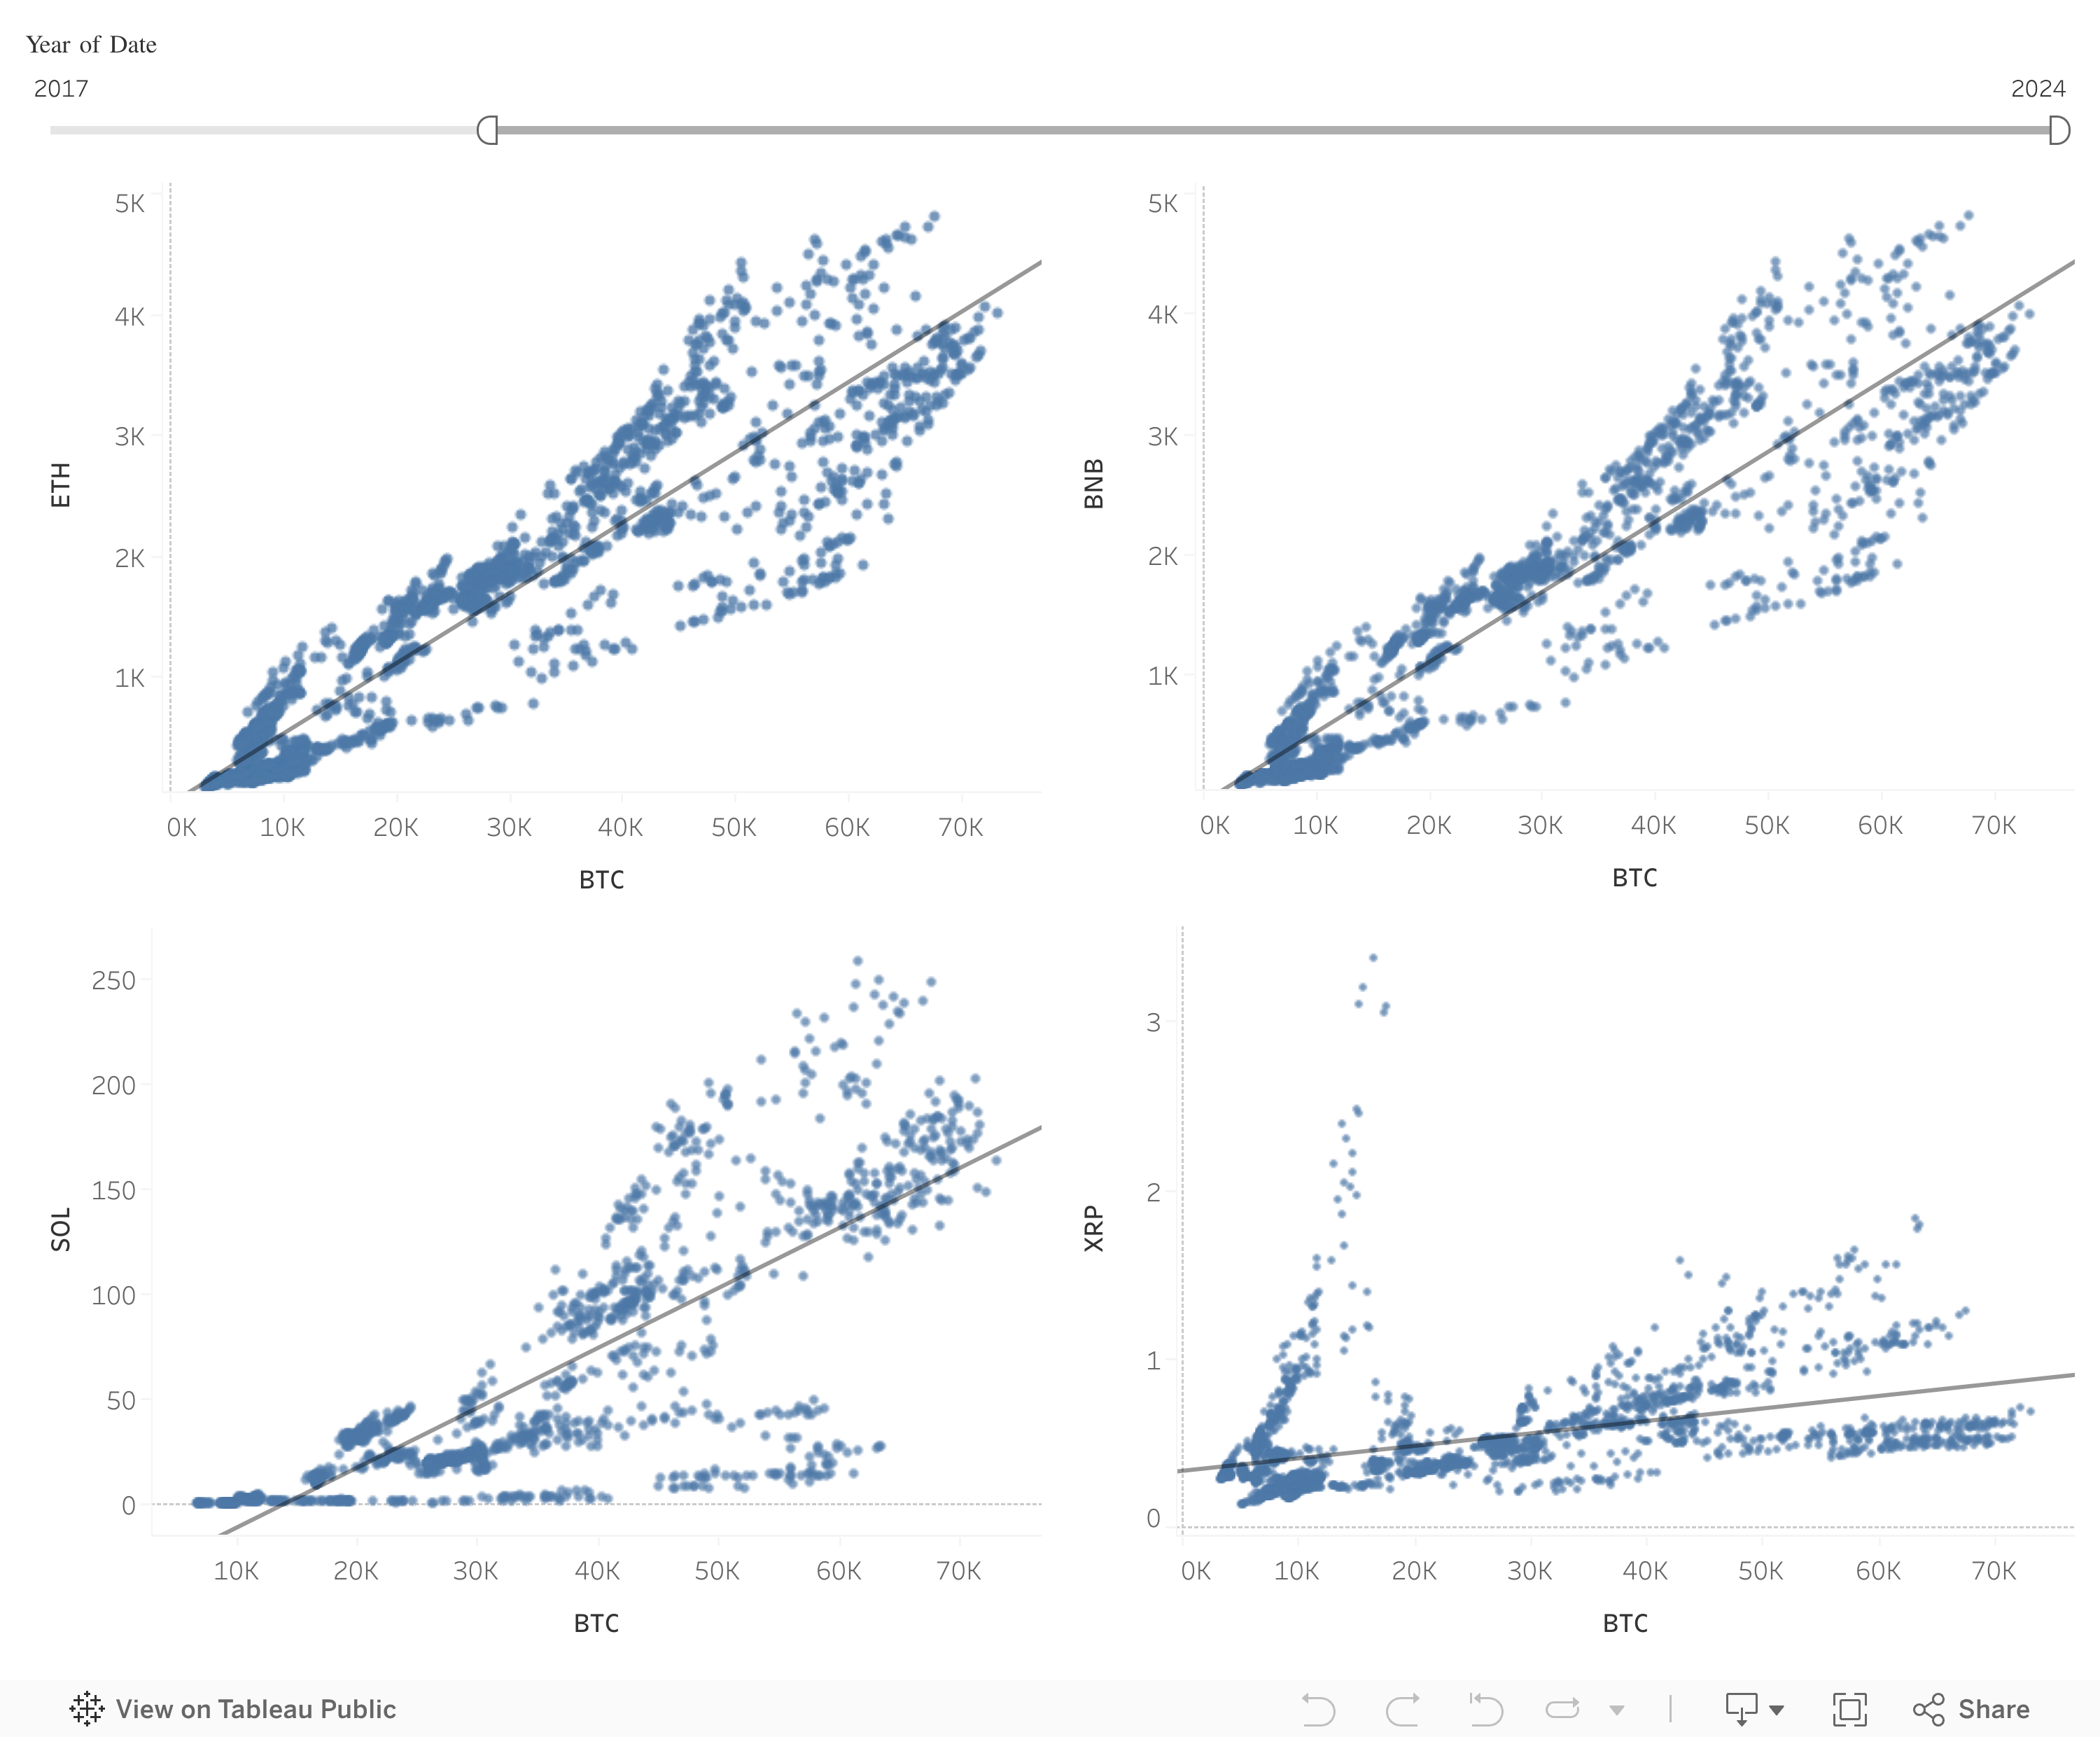
Bitcoin might be the leader, but none of these coins live in a separate universe. They all move with world events, pandemics, politics, scandals, fear, and hype.
And the more I studied historical data, the clearer it became:
-
2009 – Bitcoin launches
-
2012, 2016, 2020, 2024 – Halvings shape the market
-
2015 – Ethereum expands crypto beyond money
-
2018–2019 – Economic war knock down the market
-
2020 – COVID shakes everything
-
2022 – FTX shows how fragile trust can be
All of these moments changed the price of the coins.
And honestly? They changed my understanding of crypto too.
If there’s one thing I’d tell someone from the early 2000s trying to understand crypto, it’s this:
Crypto is not separate from the world. It reacts to everything, from a virus to a political argument to a failed exchange.
Bitcoin leads, and the others follow.
And that’s why historical data matters.
It teaches us that crypto is not independent; it’s just another part of the global story we’re all living in.