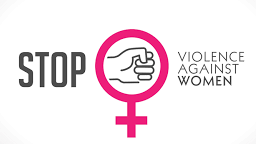
Further to inspecting the World Development Index datasets on Tableau, I was surprised by the proportion of women subject to violence in the world. Although many NGOs and organizations are working very hard on achieving equality between men and women, violence against women is still an issue that is sometimes neglected. Digging deeper into the indicators, I noticed that the proportion of violence against women is higher in countries that have no legislation to protect women or don’t abide by the existing laws.
As we can see from the below visualization, countries that enforced laws to protect against women violence had a major decrease in the proportion of violence
It is very important to increase awareness of the causes and consequences of violence and build capacity of partners to prevent and respond to violence. Moreover; we should work on promoting the need for changing norms and behavior and advocating for gender equality and women’s rights.


0 Comments