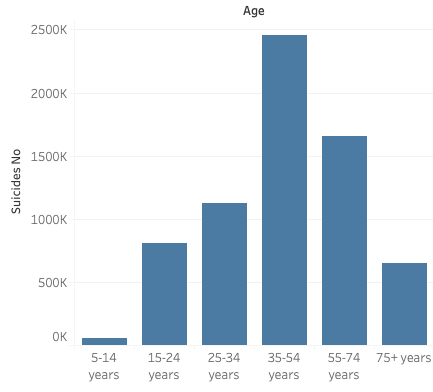
Now a day’s suicide became one of the three main causes of mortality among males and females that are 15 to 44 years old. In addition to that researches showed that Europe and Africa are the continents with the most number of suicide deaths. A study was performed to deeply analyze this topic in these two continents specifically. For this purpose, data was taken from World development index and merged with externally data from credible resources, then visuals were formed using tableau to find relationships between the variables we have and the numbers of suicides in different countries. The results show that the highest age group with suicide numbers are 35-54 years, literature shows that those age groups have the highest responsibilities. Followed by 55-74 years, a possible reason would be that people in this age should reach all their goals maybe if they didn’t, they don’t find themselves worthy of life, or the opposite, the fact that people accomplished all their goals in life and don’t see a point in living anymore.
Who is more exposed to Suicide?

SDG | SDG10 | SDG10.3 | SDG3 | SDG3.4 | SDG3.4.2 | suicide | suicide in Africa | suicide in Europe | tableau
0 Comments