One morning in February, in Kaffrine Region, Senegal, Kaffia Diallo emerged from her tent. She is happy; her new grandson was born just two days earlier. “A beautiful baby,” she said, “although I wish he weighed a little more.”
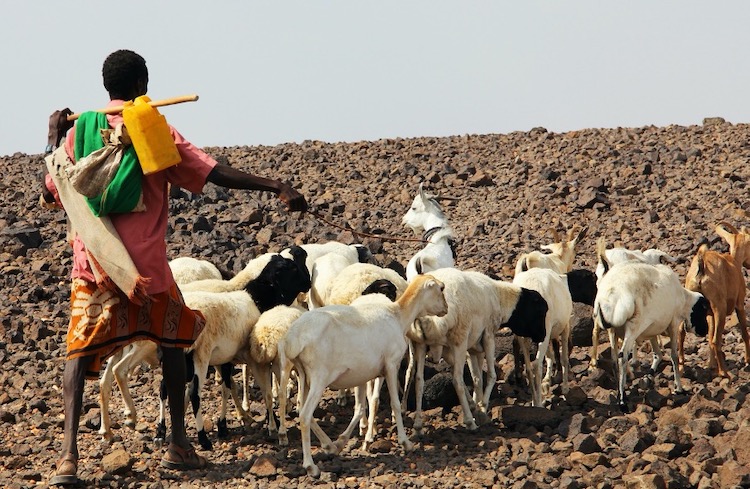
Following tradition, they will wait seven days before giving him a name. Surrounded by their herds of cows, sheep and goats, Kaffia helped her daughter with the birth in their tent in the middle of the brush, far from the closest medical center. This is nothing new for Kaffia. She comes from a family of livestock herders who seasonally move their herds from one place to another, along with some 800,000 herders in Senegal and millions of others throughout the Sahel.
With 75% of the Sahel being too dry to allow livestock herders to be sedentary, they adapt, moving their herds according to the availability of water and pastureland. “We have always been a family of herders and I began moving our herds when I was 15 years old,” Kaffia explained. “But now that I am old, I stay in the village and take care of my grandchildren.
´One billion children at ‘extremely high risk’ of the impacts of the climate crisis – UNICEF.
´Young people living in the Central African Republic, Chad, Nigeria, Guinea, and Guinea-Bissau are the most at risk of the impacts of climate change, threatening their health, education, and protection, and exposing them to deadly diseases, according to a UNICEF report.
Global average temperatures have increased by more than 1℃ since pre-industrial times. Human emissions of carbon dioxide and other greenhouse gases – are a primary driver of climate change – and present one of the world’s most pressing challenges. … Overall, this would amount to an average temperature rise of 1.1℃
- CO2emissions have increased by about 90%, with emissions from fossil fuel combustion and industrial processes contributing about 78% of the gas emissions increase from 1960 to 2020.
- Over the entire industrial era, some 2.3 trillion tons of carbondioxide have been released to the atmosphere. …
- One of the most promising initiatives and projects are the Carbon Capture Capacity projects.
- Globally, there are 15 large-scale CCS projects in operation, with a further seven under construction.
- The total CO2 capture capacity of these 22 projects is around 40 million tonnes per annum (Mtpa).

0 Comments