
In our narrative, we delve into the internal migration phenomenon within a country, where individuals from rural areas are moving in large numbers to urban centers, driven by the pursuit of education. This trend is significantly impacting the demographics of both rural and urban areas. Rural regions are experiencing a decline in their youth population, leading to a potential loss of local talent and a gap in generational knowledge. Meanwhile, urban educational institutions are becoming overcrowded and overburdened, struggling to accommodate the influx of students. This internal migration highlights the disparities in educational opportunities between rural and urban areas and raises critical questions about the sustainability of such demographic shifts and the future of rural communities.
Thus we visualized the educational institutions in Zahle district including Public and private universities and schools, Demographics of the district (percentage of youth and elderly), and the schools coverage index:
I
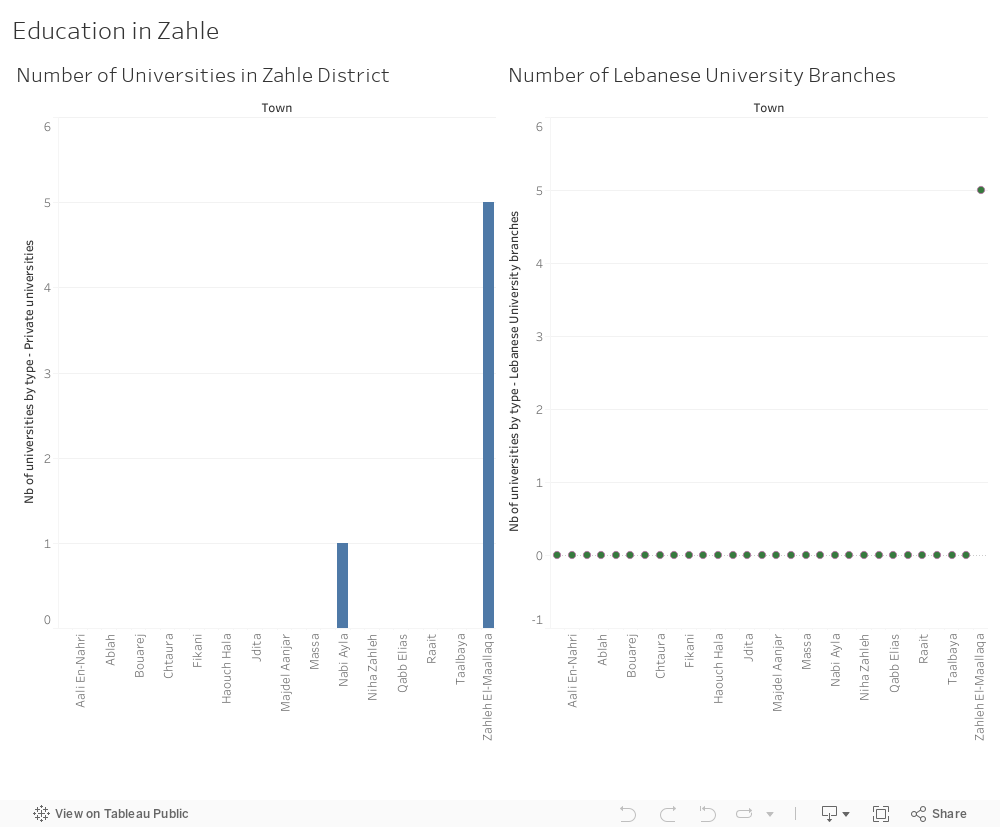
It is clear that Zahle has Limited Number of universities which limits the choices for students, also most of the universities are in Zahle district
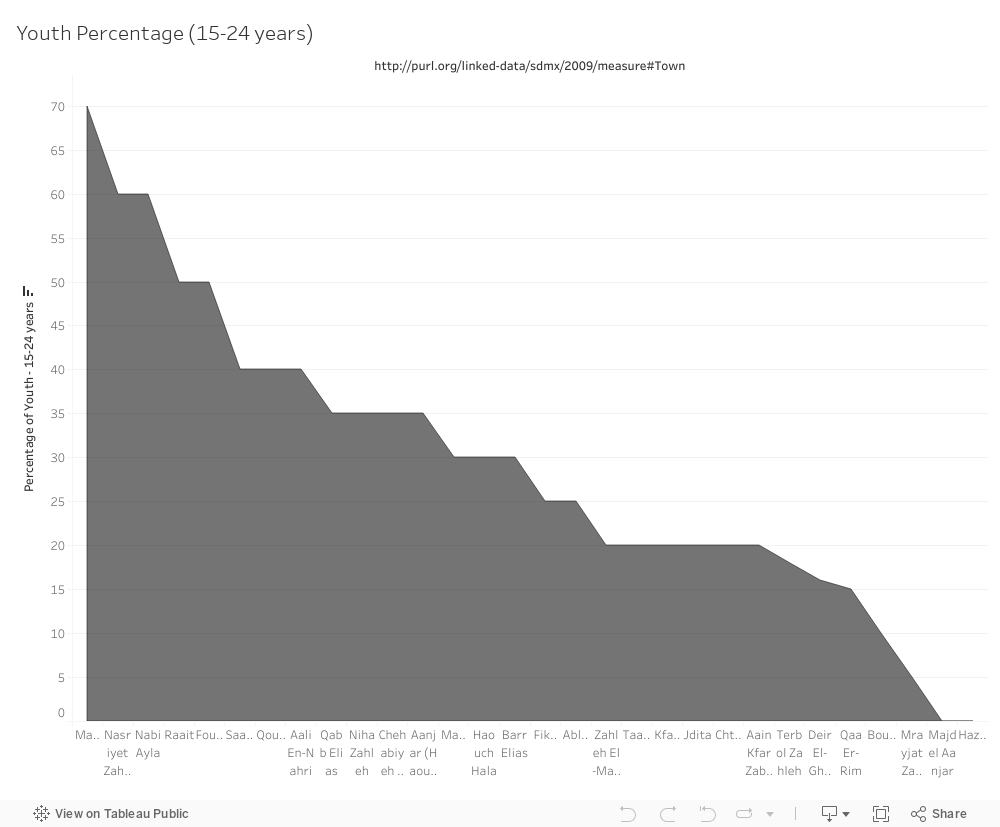
By analyzing the percentage of youth ( who age between 15 and 24 years) are less than 25% in half of the villages which is a low number and validates the change of demography
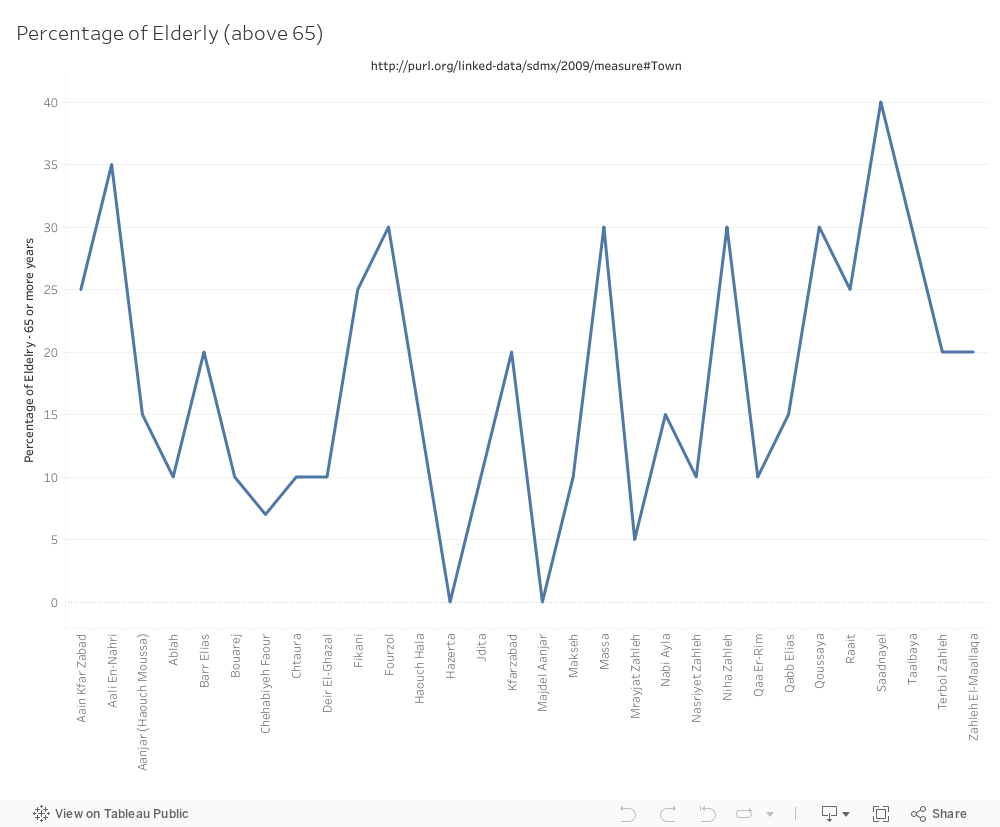
As of the percentage of Elderly, it is relatively very high in some villages (30%-40%) and as an average it is above 25% which is high also.

Regarding the Public schools coverage, we can see that half of the villages have no public schools
0 Comments