
We hear about climate change and how it is changing our planet on the news every day. According to CNN [1], a shocking new temperature record was seen just this week. The report claims that “It’s a record that will be broken again and again.” We must find a solution to address the broader climate changes around us.
The primary driver of climate change is the emission of CO2, which is mainly attributed to greenhouse gases.
By analyzing data from the World Bank in Figure 1, we can clearly observe a consistent yearly emissions increase. However, in 2020, there was a slight decrease due to the lockdown measures, which led to reduced CO2 emissions from closed factories and empty roads. It is important to note that as everything gradually returns to normal, CO2 emissions are predictably expected to increase once again.
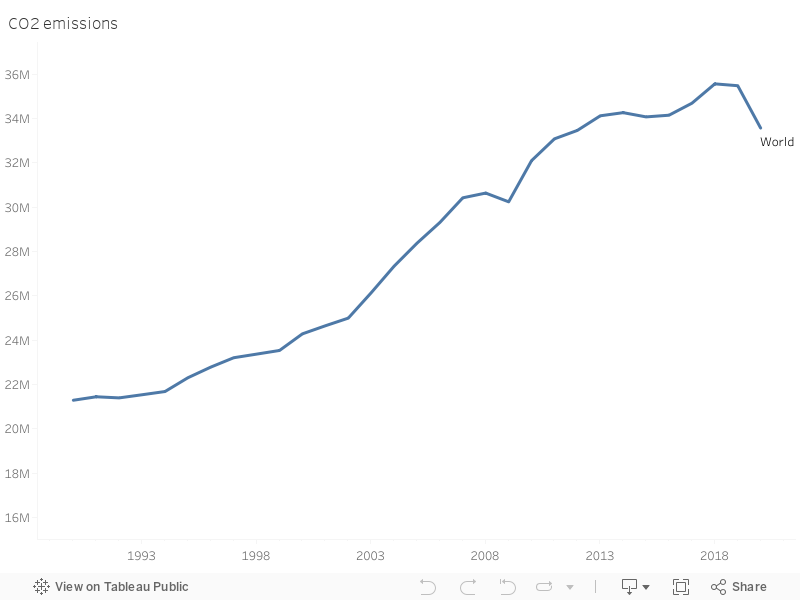
Figure 1: CO2 Emissions Over the Years
Moreover, plotting the data on world map in Figure 2, we can identify the countries that contribute the most to CO2 emissions. Notably, countries with high income[2], including USA, China, and various European nations, bear significant responsibility for such emissions.
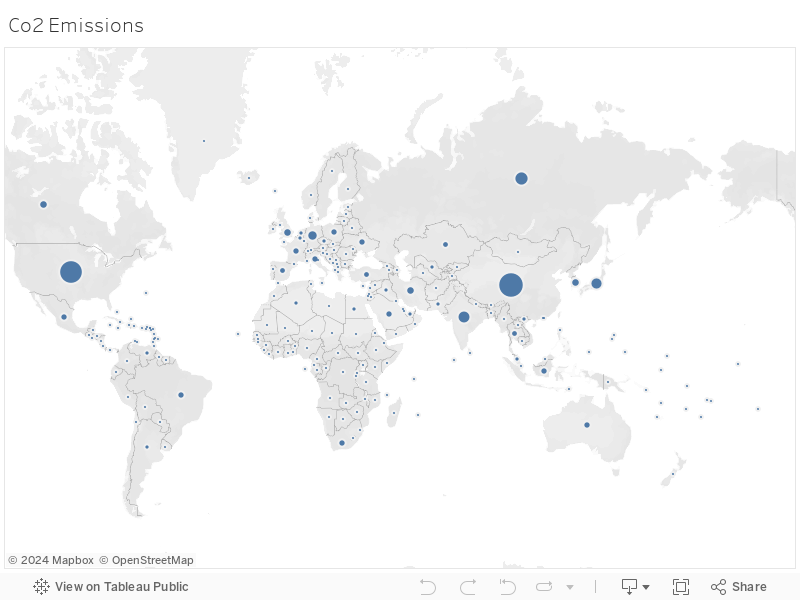
Figure 2: World Map of CO2 Emissions
However, by examining the annual CO2 emissions of higher-income[2] countries and comparing them to their electricity production from renewable sources, we can clearly see the positive impact of investing in renewable energy, as demonstrated in the interactive dashboard below. Since 2009, these countries have witnessed a decline in CO2 emissions, while medium-income countries have surpassed them. This evidence strongly supports the idea that investing in renewable energy is an effective means to reduce our carbon footprint.
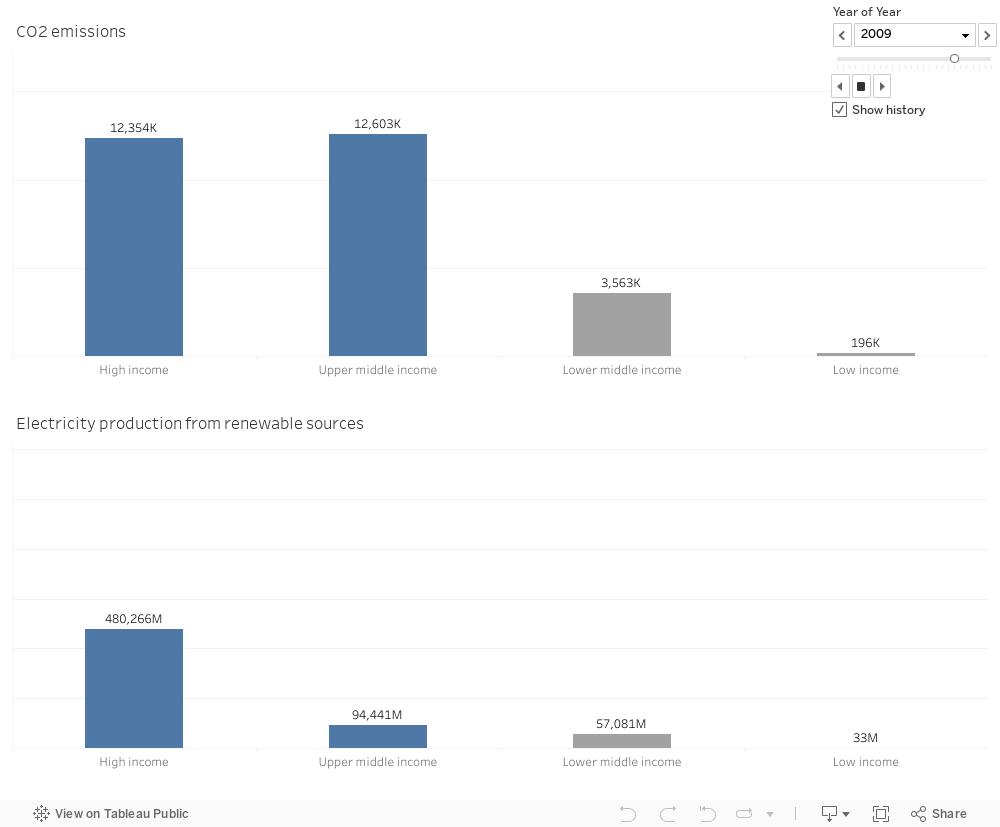
Figure 3: Interactive Dashboard CO2 emissions VS Renewable Energy
To validate my assumption, I took Germany and United Kingdom as examples of high-income countries and thoroughly investigated available data spanning several years, as shown in Figure 4. It is clear that investing in renewable energy reduces CO2 emissions significantly.[4]
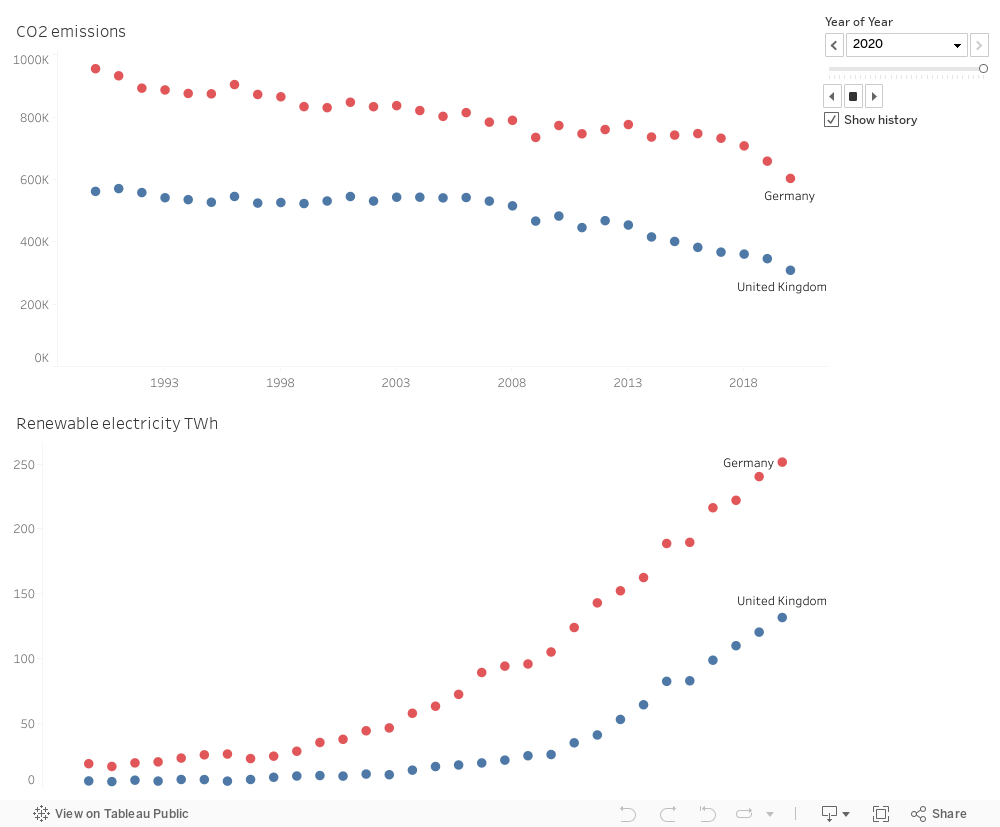
Figure 4: Decrease of CO2 Emissions in Germany and France due to Investments in Renewable Energy
In conclusion, embracing renewable energy solutions is an active way to reduce CO2 emissions. I believe that the world should unite, and high-income countries should assist others in investing in renewable energy, because the consequences of climate change is affecting all of us. By doing so, we can safeguard our planet and forge a healthier, more sustainable world for future generations.
References:
- CNN, the planet saw its hottest day on record this week, https://edition.cnn.com/2023/07/05/world/hottest-day-world-climate-el-nino-intl/index.html
- World Bank country classifications by income level, https://blogs.worldbank.org/opendata/new-world-bank-country-classifications-income-level-2022-2023
- BP Statistical Review of World Energy, https://ourworldindata.org/grapher/elec-fossil-nuclear-renewables?tab=table&stackMode=absolute
- Tableau Dashboard, https://public.tableau.com/app/profile/bechara.abourahal
0 Comments