

The Climate Blog
“What is measured is managed”. As the COP conferences are held annually, countries deliver a package of decisions that reaffirm their commitment to limit global temperature rise to 1.5 degrees Celsius above pre-industrial levels. The packages often also strengthen Nationally Determined Contributions (NDCs) to cut greenhouse gas emissions (GHGs) by countries as they investigate their targets in respect to baseline-level scenarios. While GHG measurements annotate greater climate responsibility across regions, a different allocation is further segregated by sector. Hence, GHG regional and sectorial metrics are set to be a tool to channel aggressive focus on the most polluting sectors; nonetheless, transportation, by region.
#ClimateChange #COP #GHG #SustainableTransport #SDG13 #SDG11
How Serious is the Problem?
Climate change is expected to displace millions of people and the worry increase that we may be pushing the planet toward ecological collapse. It is our belief that CO2 emissions will get worse as the world continues to develop.
“The time is past when humankind thought it could selfishly draw on exhaustible resources. We know now that the world is not a commodity, is not a source of revenue; it’s a common good, it’s our heritage”.
— François Hollande, former president of France
The following world map shows the Global levels of CO2 emissions in 2019, with China and India among the highest contributing countries

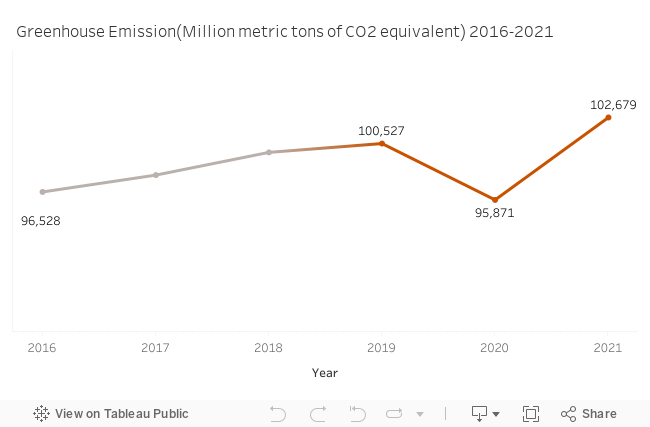
The increase of CO2 Emission shows that trend has no sign of abating.
As shown in the graph, there has been a constant increase in CO2 emissions globally. However, one could only spot an evident, sharp drop that attributes to the COVID-19 pandemic phase. Alternative, slower activities are a witness that CO2 levels indeed could be hampered, and action could be taken before the ramifications are rather irreversible.
To understand the determinants and distribution of CO2 emission globally, data analysis was conducted using the data from the World Bank organization – across Manufacturing & Construction, Residential & Public services, Transportation & other sectors. Results have showcased that Transportation was the highest emissions contributor amongst all, with a 27.45% average CO2 emissions in terms of fuel combustion.

“Taking on transport-related carbon emissions has become an urgent priority in the race against climate change.”
Findings depict that the race towards net zero emissions is a crucial agenda item. Without rigorous action to promote sustainable modes of transportation – within the spectrum of induced accessibility to public mobility and transitioning from fuel to electric vehicles, the 2030 agenda of sustainable development and UN targets would rather be an illusion. This of course should be coupled with focus on energy transitions, biodiversity, water resources and circular economy, with countries acknowledging their share of responsibility.
0 Comments