
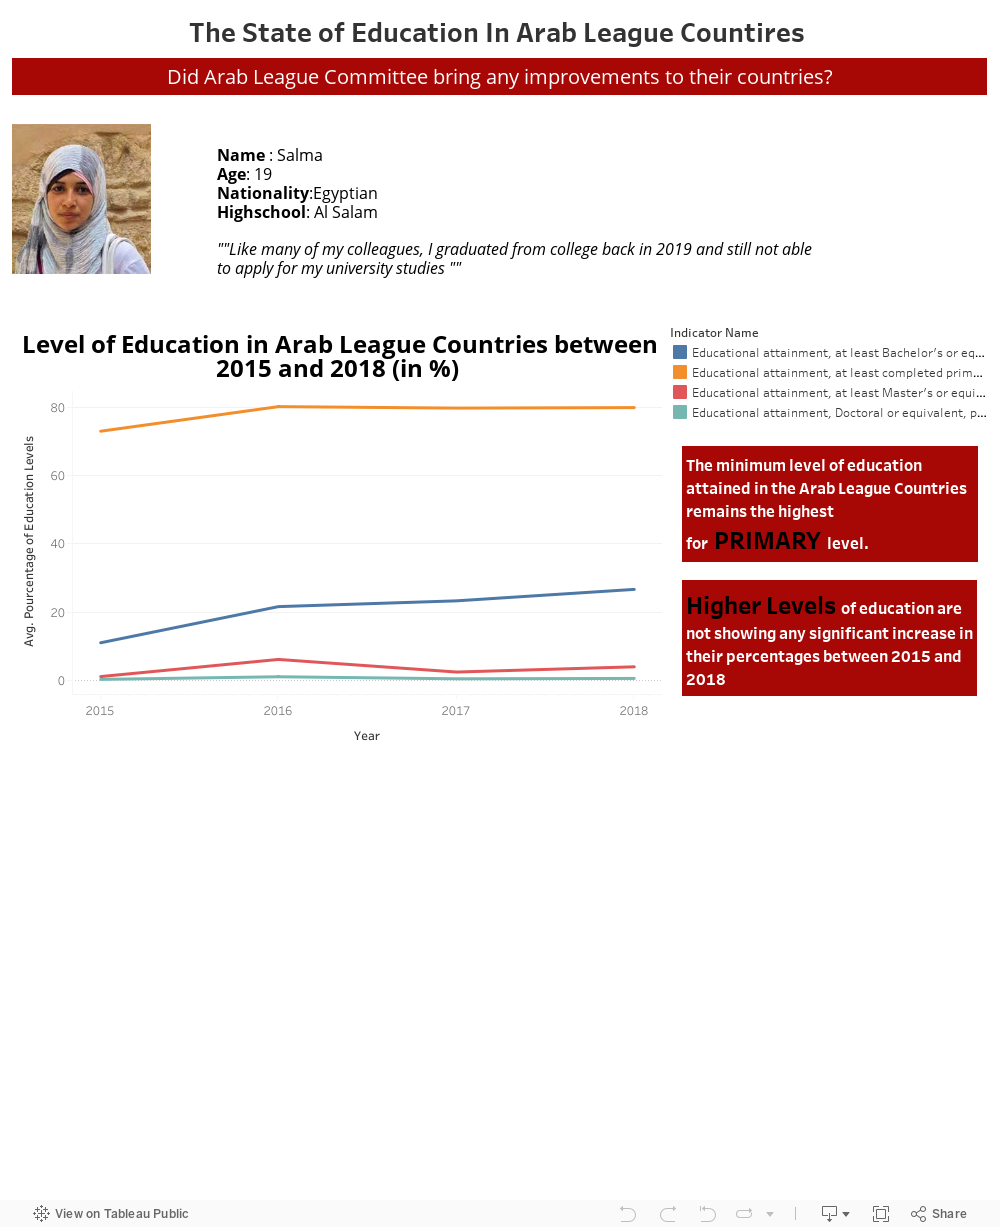
Like many of my colleagues, I graduated from college back in 2019 and still not able to apply for my university studies ” said Salma, an Egyptian student, from Al Salam high school when she was asked about the state of education in her country. Is Salma an exception?
No!
Salma could be ME!
Salma could be YOU!
Salma is every student in arab world suffering to seek proper higher education.
Although the Arab League consider education to be the most effective tool for advancing the Arab society, when closely examining statistics on the status of education in the Arab region, the main conclusions have pointed to a deficit in educational attainment.
Using the world bank indicators data related to education, I was able to achieve a simple visualization that fully support my purpose of the presentation: the minimum level of education attained in the Arab League Countries remains the highest for the PRIMARY level and no significant improvement was really detected between these 3 years as the BACHELOR, MASTER and DOCTORAT levels are approximately the same.
The data highlight an urge need of innovative interventions that can transform education systems and schools across the region.
0 Comments