Data Visualization

Blog of the Data Visualization & Communication Course at OSB-AUB

This is my favorite part about analytics: Taking boring flat data and bringing it to life through visualization” John Tukey

Race of the giants

by | May 5, 2021 | Dashboard, Visualization | 0 comments

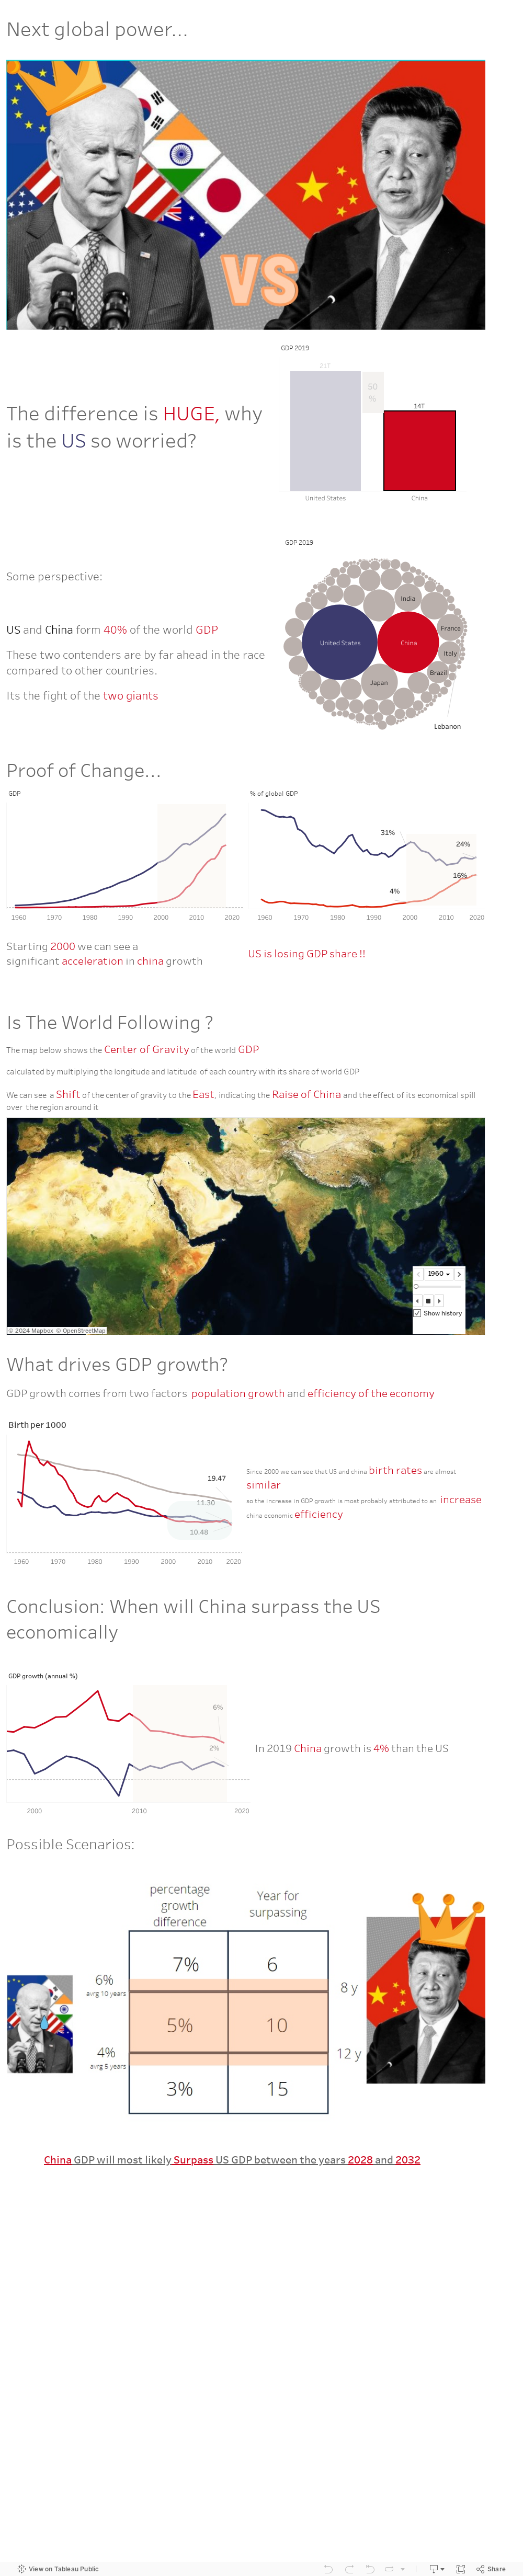
With China’s economic rise threatening the US, the rivalry between the two countries is at its peak; political tensions, trade wars, military maneuvers,…I will visualize in this post the shift of the economic power from the West towards the east, a shift that is undermining the US monopoly on world power, changing the world as we know it.


0 Comments

Submit a Comment

Your email address will not be published. Required fields are marked *