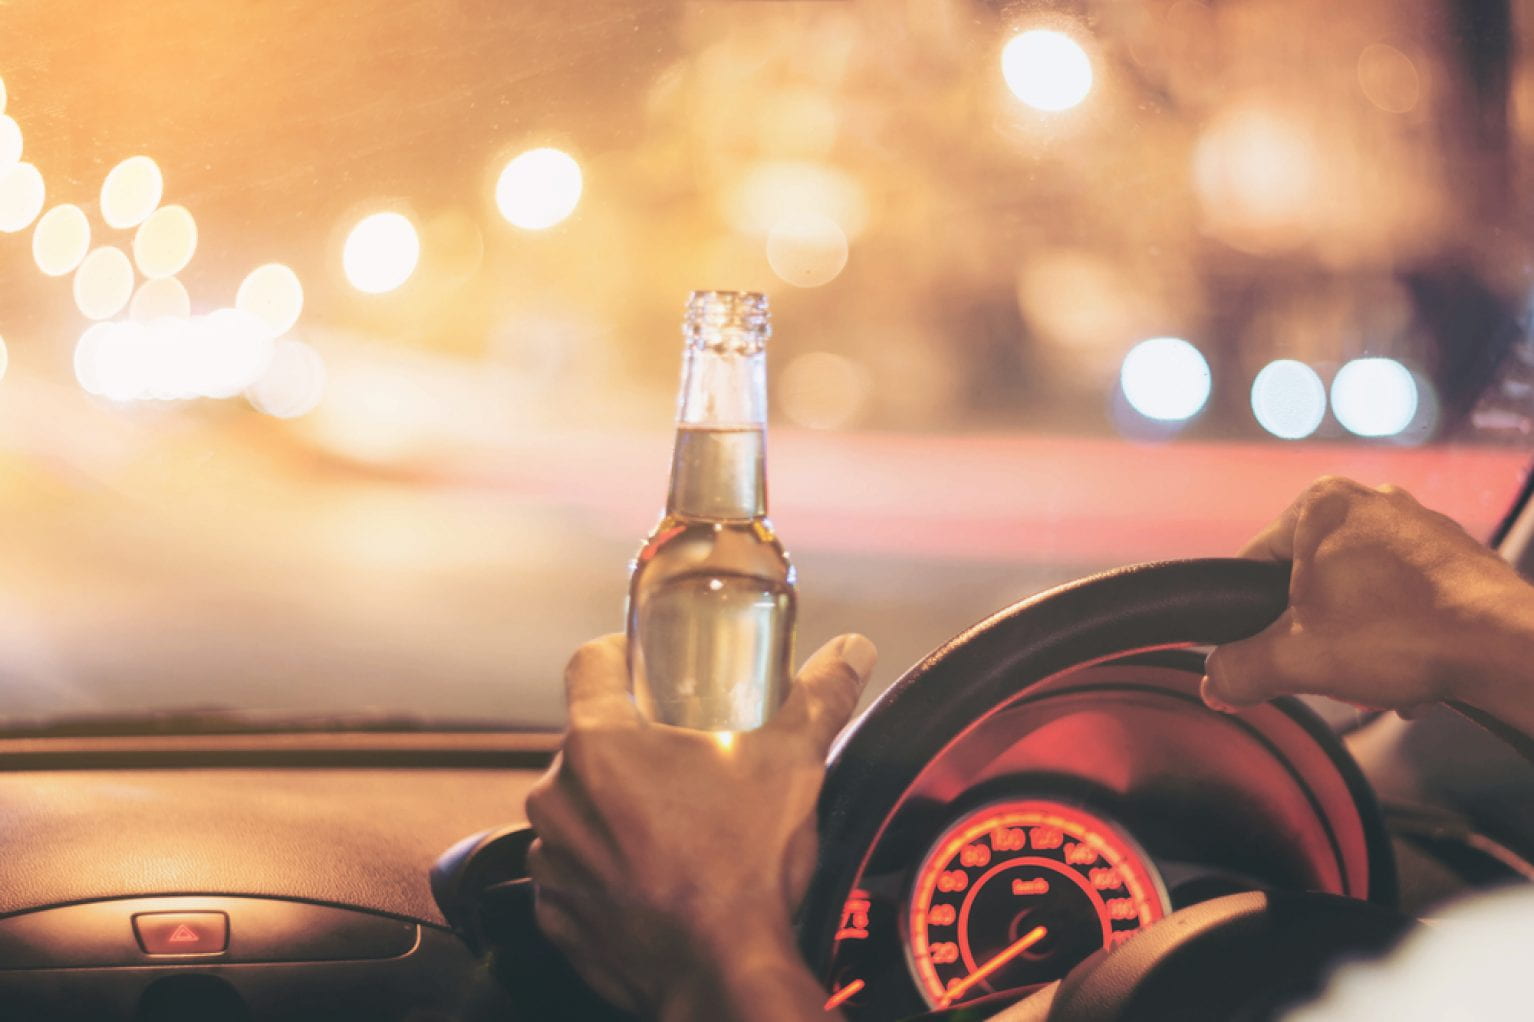
In every Lebanese driver, there is a hidden Michael Schumacher inside of him/her. Unfortunately with all NGOs providing all possible resources for the promotion of road safety awareness, car accidents numbers are all the way up. The sad part is that drinking and driving is illegal but do we really abide by this law. When was the last time you called a taxi because you were drunk? And the most important aspect is that car Speed is a competition and a show off.
It was interesting to find through the below dashboard that most car accidents happens during summer season (July and August).
The dataset contains both monthly and yearly statistics of car accidents in Lebanon from 2007 to 2019. This dataset is aggregated by the number of car accidents, the number of injuries, and the number of fatalities.

0 Comments