
The Long Climb: How External Debt Built Lebanon’s Financial Cliff
Lebanon’s economic crisis didn’t erupt suddenly in 2019. It built up slowly—quietly—over years of borrowing. Every year added a little more pressure until the numbers turned from warning signs into weight, and that weight eventually buckled the country’s financial foundations.
To understand how early the signals appeared, I visualized Lebanon’s external debt from 2002 to 2022, using data from The World Bank.
This dataset captures Lebanon’s total external debt (in USD) year by year—essentially recording the country’s financial pulse over two decades.
What the Data Reveals
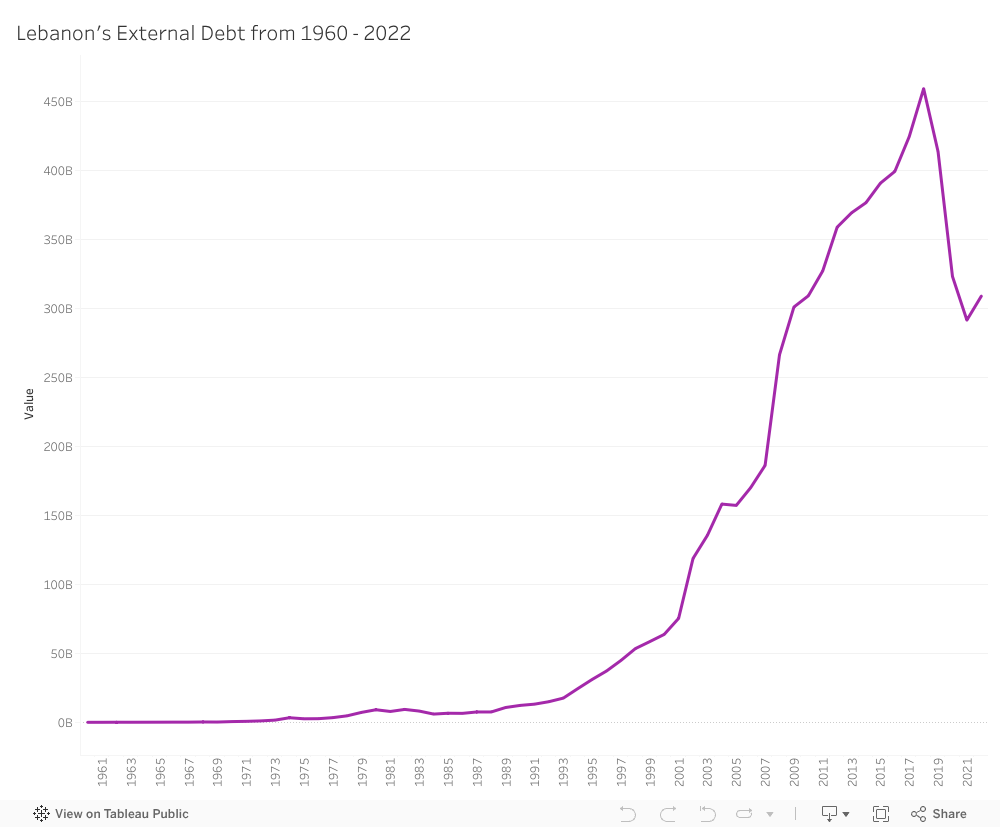
When we look at the timeline, a clear pattern emerges:
-
2002–2006: A steady but noticeable escalation.
-
2008–2011: Debt doubles within a decade, marking the first major alarm.
-
2015–2018: A sharp spike pushes debt levels to their peak (≈ $80B).
-
2019–2020: Crisis years—external debt becomes heavier relative to GDP, amplifying instability.
A second visualization examining year-over-year changes shows the most dramatic jumps happened in the mid-2000s and again just before the collapse, highlighting long-term structural vulnerability.
Why These Trends Matter
Lebanon’s external debt did not explode overnight—it grew in phases, accelerated by structural weaknesses, and slowed only briefly. The crisis was not a sudden event; it was a pattern, visible long before it reached bank withdrawals, street protests, and currency freefall.
When visualized clearly, the message becomes unmistakable:
The crisis wasn’t unexpected.
It was written in the data years before it became visible in daily life.
0 Comments