
Our world faces an ongoing and formidable challenge with the relentless rise in energy demand, which is accompanied by an alarming increase in carbon emissions (CO2) and environmental degradation. Both factors have a profound impact on climate change and pollution and this is mainly due to the significant contribution of traditional energy sources. Thus, a crucial transition towards sustainable energy alternatives becomes imperative!
However, a critical question arises here: How can we measure the progress and effectiveness of this transition? That’s where our exploration of renewable energy consumption rate from the total energy across regions comes in. By examining this key metric, we can uncover insights into the pace and effectiveness of the shift towards sustainability.

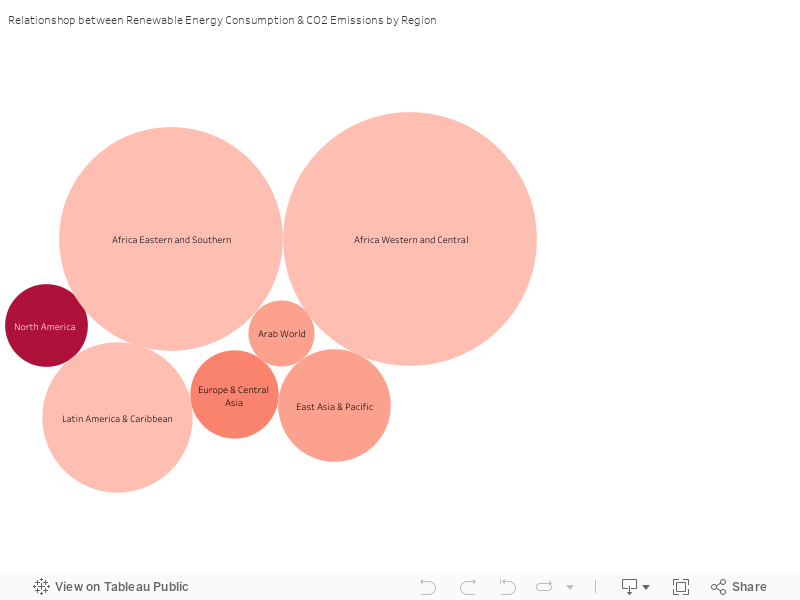
The above visualization reveals significant disparities in the average rates of renewable energy consumption among the seven considered regions:
• Africa Western and Central stand out with an impressive average rate of 80.48%, closely followed by Africa Eastern and Southern at 62.57%.
• However, regions like North America, Europe & Central Asia, and East Asia & Pacific exhibit lower average rates, ranging from 8.56% to 28.27%.
• Unfortunately, the Arab World stands out with the lowest average rate of renewable energy consumption at 5.47%.
These disparities highlight the need to examine regional trends and identify areas for improvement.
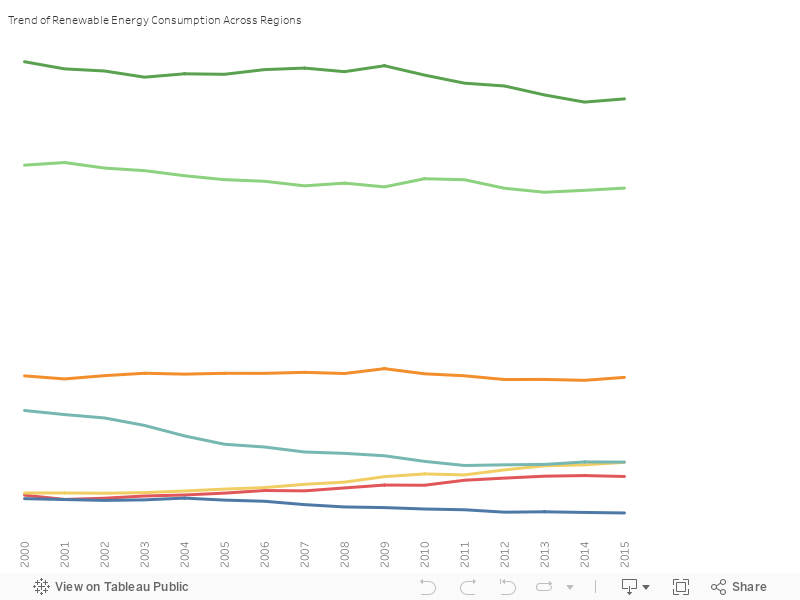
Additionally, the below line chart portrays the trends in renewable energy consumption from 2000 to 2015 provides further evidence:
• Regions like Africa Western and Central display a relatively steady trend, indicating a successful and consistent approach.
• Others, such as Africa Eastern and Southern, showcase a gradual decline followed by a stable trend.
• Meanwhile, regions like East Asia & Pacific, Europe & Central Asia, Latin America & Caribbean, North America, and the Arab World demonstrate varying levels of growth and fluctuations in renewable energy consumption over the years.
Based on the above analysis, we propose studying successful cases and embracing collective learning. This approach will allow us to develop comprehensive strategies for effectively adopting sustainable practices. By understanding specific policies, initiatives, and key factors driving regional success, we can replicate and adapt these strategies to other regions.
Validating the success of the implemented strategies by analyzing their potential outcomes, particularly in terms of reduced carbon and greenhouse gas emissions rates is a must. Visualizing the relationship between renewable energy consumption and CO2 emissions using a Bubble Chart further confirms the importance of renewable energy adoption. Regions with higher average rates of consumption tend to exhibit lower CO2 emissions.
In conclusion, we recommend to accelerate the transition to renewable energy sources and promote sustainable energy adoption by:
• Increasing the efforts in alignment with the country’s economic and technological potentials.
• Continuous tracking and evaluation of renewable energy consumption and CO2 emissions rates are essential to assess the effectiveness of the implemented solutions.
• Regions with lower rates of renewable energy consumption can learn from successful models, like Africa Western and Central, to enhance their strategies and promote sustainable energy adoption.

0 Comments