by | Apr 15, 2022 | Visualization
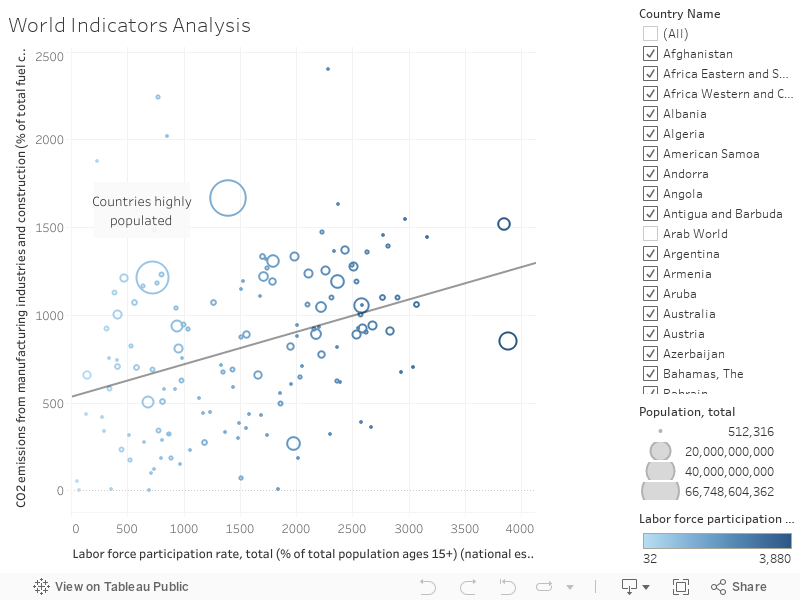
Greenhouse gases, especially carbon dioxide (CO2) emissions, are viewed as one of the core causes of climate change, and it has become one of the most important environmental problems in the world. International production fragmentation has led to substantial changes in labor market, such as job creation/job loss, changing labor market structure and labor productivity. Such changes are perceived to affect CO2 emissions of those economies that participate in different parts of global value chains. Is there a relation between Labor Force, Population, Life Expectancy, and CO2 emissions? Developed countries which is reflected by high life expectancy value can better handle manufacturing while maintaining low levels of CO2 emissions.
Can we reduce emissions without hurting jobs or companies’ financial performance?
The problem is the high pollution rate in manufacturing and populated countries around the world have been witnessing increase in CO2 emissions as population and labor force increased. According to the World Development Indicators dataset, CO2 emissions increases from manufacturing as labor force increases. The trend line is an increasing straight line (positive slope) which means that as the labor force is increasing the CO2 emissions are increasing. This means the manufacturing process is a source of pollution.
Moderate the manufacturing process using environmental-friendly techniques
- Increase investment in research and development to find new technologies to make the manufacturing process more eco-friendly.
- Increase spending (buy new technology) to manage an environment friendlier manufacturing process.
Find feasible methods to make the manufacturing process environmentally friendly and monitor the progress through:
- Using Energy efficiency
- Fuel switching
- Combined heat and power
- Use of renewable energy
- The more efficient use and recycling of materials
Russian Federation/ Singapore
- Singapore’s Inter-Ministerial Committee on Climate Change (IMCCC) drives the whole-of-government effort to develop Singapore’s climate change mitigation measures. These consider Singapore’s national circumstances and challenges. Studies and technology roadmaps developed in collaboration with industry stakeholders, academic experts, and technical consultants, served as additional inputs on the potential of future technologies for long-term mitigation in Singapore. Public consultations were also carried out to obtain feedback on possible measures to reduce carbon emissions, and to promote green growth. Singapore’s broad strategies are reflected, inter alia, in the National Climate Change Strategy 2012 and the Sustainable Singapore Blueprint 2015. Legislation and regulations are also regularly reviewed to respond to new developments.
- Singapore has put in place early policy choices that “reduced our GHG emissions, for example by switching from fuel oil to natural gas– the cleanest form of fossil fuel – for power generation.”
- The Boston Consulting Group (BCG) has developed “The CO2 AI Product Ecosystem” which is “an AI-enabled platform that allows all members of a company’s ecosystem to exchange product-level data, empowering organizations to compute their own carbon footprint.” This will help organizations and governments keep track of their carbon emissions/ footprint and is a method to hold manufacturers accountable.
Recommendations: Implementation of policies
- Governments must put in place policies that oblige manufacturers to alter their process to manufacture in an environmentally friendly way.
- These policies should encourage the use of:
- renewable energy,
- fuel switching,
- recycled materials to decrease their carbon footprint.
by zrm01 | Apr 15, 2022 | Uncategorized
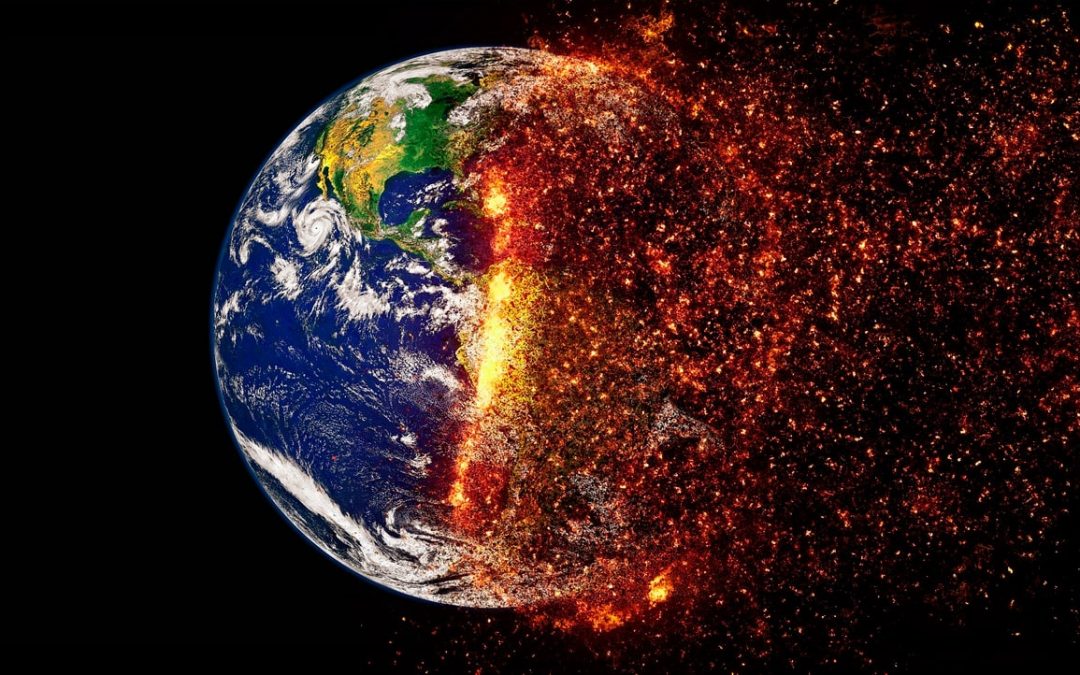
Clean Energy and Climate Change
Switching to clean energy sources, like nuclear energy or hydraulic energy must happen as soon as possible. We all know what climate change is, and we’re all feeling it in the modern days. Having extremely cold winters, exactly like the one we just experienced in Lebanon, and very hot summers. Extreme weathers are happening all over the world, and more and more places are turning uninhabitable due to increase in sea and water levels as well as the increase in temperatures.
And the really bad news is that all of this is irreversible. And not decreasing the rate of greenhouse gas emission (the types of gases that cause climate change like carbon dioxide) will exponentially make global warming worse where no place on earth will be inhabitable.
Population is increasing at a very fast rate, forecasted to reach 8 billion by 2023. and more and more people need energy for their everyday lives. From driving cars, to using electricity at home. The current energy source used is mainly natural gas, which when combusted releases great amounts of CO2 in the air. And more land is required to be able to fit this many people.
CO2 emission from electricity production is increasing rapidly with time which is making climate change worse.
And this is mainly due to the power usage per capita. More and more energy is being required by every single person as the years pass. Combining this with the rapid population increase is a recipe for disaster in terms of greenhouse gas emission and climate change.
There are many energy sources that mankind uses in the present day, like hydraulic energy, wind energy, energy from oil and natural gases and many others. Some being renewable energy and clean energy and the others being harmful to the environment and contribute to global warming.
But when we divide them into two categories, one being clean energy sources and the other being energy sources that emit green house gases, we can clearly see the problem we are facing. Less than 20% of the total energy used around the world comes from clean energy sources. And the percentage of energy coming from clean energy sources doesn’t change with time. Meaning that we still use the same type of energy we used 50 years ago and no changes were made.
While everything is changing around us with technology, with self driving cars, phones that can do practically anything, why isn’t most of our energy coming from renewable sources.
The 17 goals set by the United Nations for sustainable development include affordable and clean energy, as well as climate action.
The question is, why aren’t we switching to clean energy sources and achieving 2 goals out of the 17 by one simple action.
Ziad Moghabghab
202224793
by nae51 | Apr 15, 2022 | Uncategorized

2022. Climate change. DROUGHT. Increasing DROUGHT periods. Shorter Time Between these DROUGHT periods. FAMINE.
Meet Zahi. Zahi is a 10 year old Somali boy who lives in Somalia. He has been suffering from acute malnourishment for a good while now.
In fact, as of 2022, it was reported that around 4.1 Million Somalis are just like Zahi: all acutely malnourished, or even severely malnourished. In other words, this means that 1/4th of the Somali population is at the very least acutely malnourished. What can that cause, you may ask? Illnesses, poor physical and cognitive development, and ultimately, death.
This makes Somalia the hungriest country in the world. If you are wondering how hunger is measured, it is by using a metric entitled the Global Hunger Index (GHI). The latter is calculated by gathering data about:
- Undernourishment: share of people in a given region/country whose caloric intake is deemed insufficient,
- Child Undernutrition: share of children under 5 who have low weight for their height (wasted children) and thus suffer from acute undernutrition, but also the share of children under 5 who have a low height for their age (stunted children)- which indicates chronic undernutrition,
- Child Mortality: mortality rate of children under 5 who die because of inadequate nutrition and unhealthy environments.
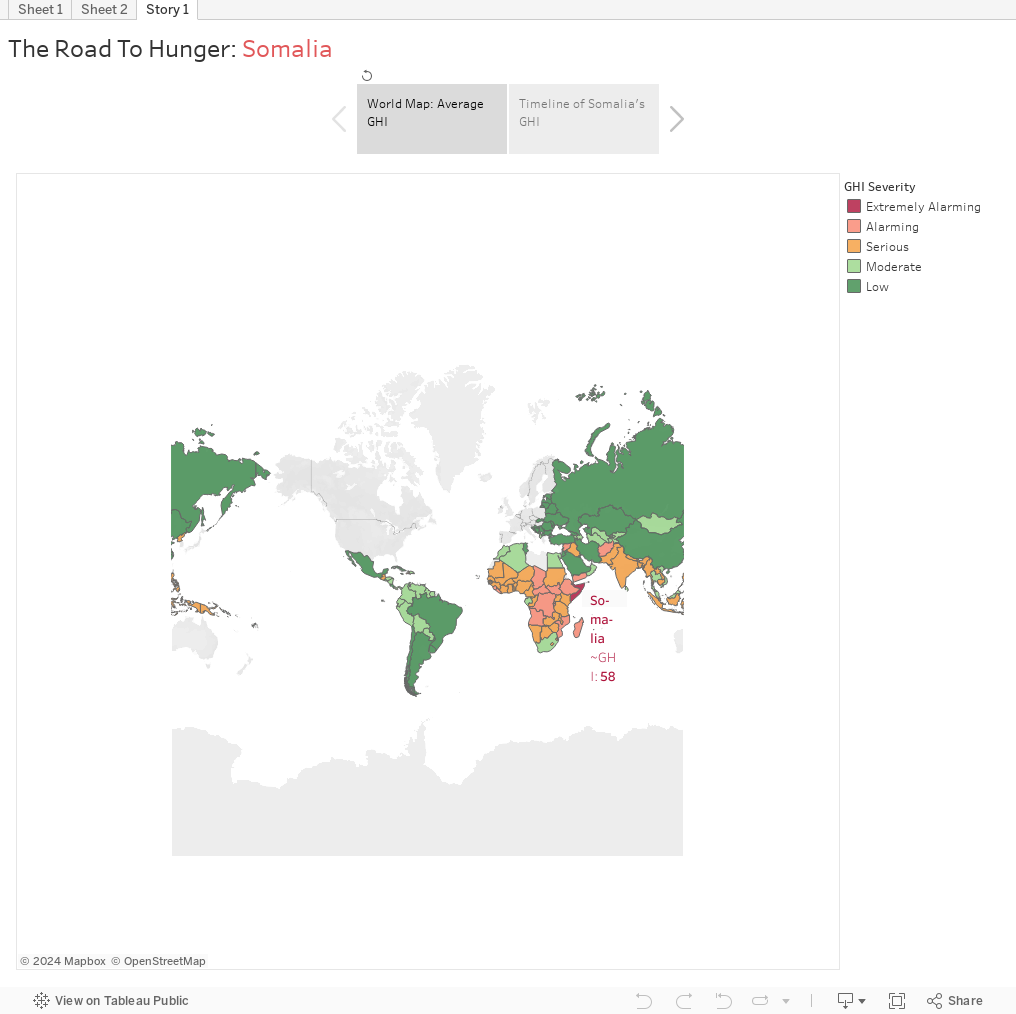
To visualize the world’s hunger, the map that can be viewed in Sheet 1 below or on this link has been created.
We notice that Somalia is indeed the only country in the world with an extremely alarming Global Hunger Index, with an average GHI of 58 over the past 20 years.
What makes the situation in Somalia this dire and helpless? Well, to say the least, poverty coupled with and aggravated by governmental corruption, several outbreaks (to list a few: cholera, malaria, measles, corona), inflating prices (notably with the current Russia-Ukraine crisis) and most importantly the series of drought periods that have been happening consecutively over the past years, with the 2011-2012, 2016-2017 and 2021-2022 crises counting as the 3 major and most recent drought crises that have happened (and are still happening). Moreover, drought means death of livestock, no water, parents abstaining from eating to feed their children the very little food they have access to, and overall hunger. One must note that droughts have always happened in Somalia (and in the Horn of Africa generally), meaning that the Somalis are used to drought, and they had adapted to it, knowing how to pick themselves up and continue. However, with climate change, these drought periods have become more acute and consecutive, with shorter periods separating them, hence disabling Somalis from the chance to recover from the last drought.
Alright, now what is the solution?
The deployment of an immediate humanitarian response: gathering funds through non-governmental organizations or even governmental donations which aim (but are not limited to) to sending emergency water supplies, sending food donations, treating the malnourished, distributing dietary supplements, opening and running health supplies but also giving out cash and livelihood support to those who are most in need.
Does this help?
Yes. It does.
As a matter of fact, just like the graph on Sheet 2 below shows (or the one you can see on this link), in 2012, Somalia’s GHI was measured at an all time high of 65. Thanks to the donations and the humanitarian responses that happened between 2011 and 2020, Somalia’s GHI dropped to 50.8. Magical, right? Arguably the GHI all time high of 65 could have been prevented in the 2011-2012 drought crisis had the international scene acted quicker than they did: in fact their response was so slow that thousands had died by the time aids reached. It was indeed deemed a failure. Moreover, back then only 56% of the UN’s funding appeal for Somalia were met by donors, whereas during the 2016-2017 drought crisis, the international scene responded quicker and more acutely, with 68% of UN’s funding appeal for Somalia being met by donors.
However, it is to be noted than today, in the ongoing 2021-2022 drought crisis, merely 2.3% of the UN’s total funding appeal for Somalia have been met by donors. 2.3%. Furthermore, according to Mohamud Mohamed, Save the Children’s Country Director in Somalia: “Donors have a narrow window to prevent a major humanitarian disaster in Somalia (…)We’re worried that the political environment globally is overshadowing the humanitarian suffering of the Somali people.” As Mohamed said, the eyes of the world are focused on Ukraine, and are overlooking the rest of the world. Unequal treatment kills.
And the time, my friends, is ticking.
Written by Nour El Saadi.

by mim26 | Apr 14, 2022 | Uncategorized
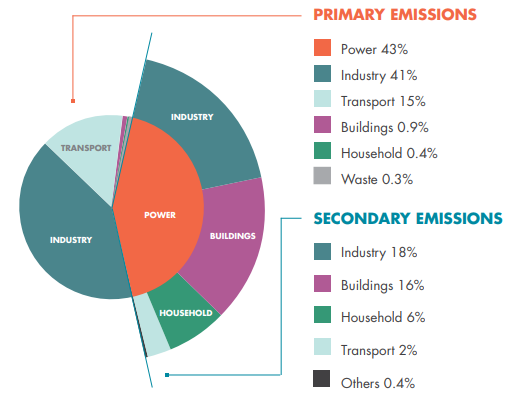
The Arab World has been witnessing an increasing number of greenhouse gas emissions (Figure-1), and we are not doing anything about it.
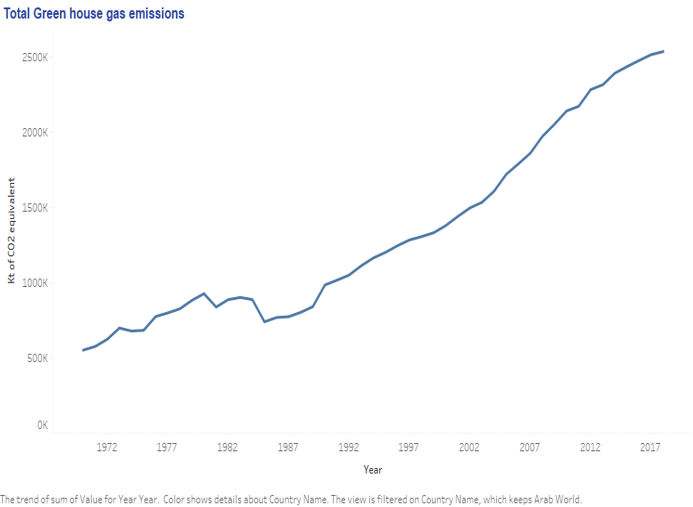
Figure-1
A result of This increase is the climate change which is manifested in the record-breaking temperatures witnessed in summer 2021 in several countries within the Arab World, such as, in Iraq, Kuwait, KSA and even Lebanon. High temperatures mean endangering our food security as with the high temperatures the yields of major crops are reduced, their nutritional value also, this means less supply and higher food prices.
The solution is already available, it is solar energy, as 80% of the land in the region is covered by deserts, making use of it will of course decrease the dependency on fossil fuels and that would be the first step toward tackling climate change in the region.
This solution is already being implemented by other countries, for example, the European union, and data show (Figure-2) that the total number of greenhouse gas emissions has been decreasing for them and this is associated with an increase in the proportion of their electricity output that is generated by renewable energy.
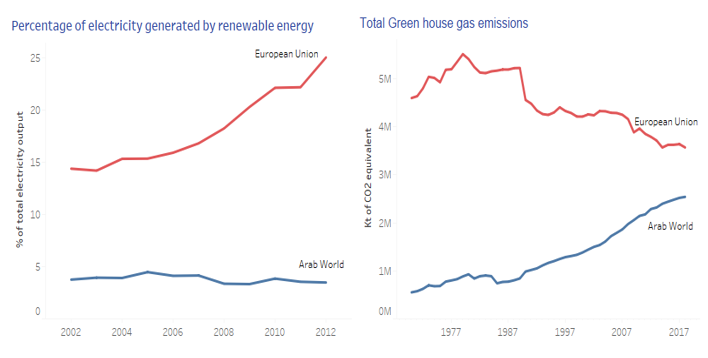
Figure-2
Finally, it is worth mentioning that for some of the European countries who are depending more on renewable energy are investing in north-African deserts such as in Algeria and Tunisia, so this is a proof that we already have significant exposure to solar radiation and enough land area, and these resources, if used correctly can make an impact in addressing the problem of climate change.
by nhc11 | Nov 24, 2021 | Uncategorized
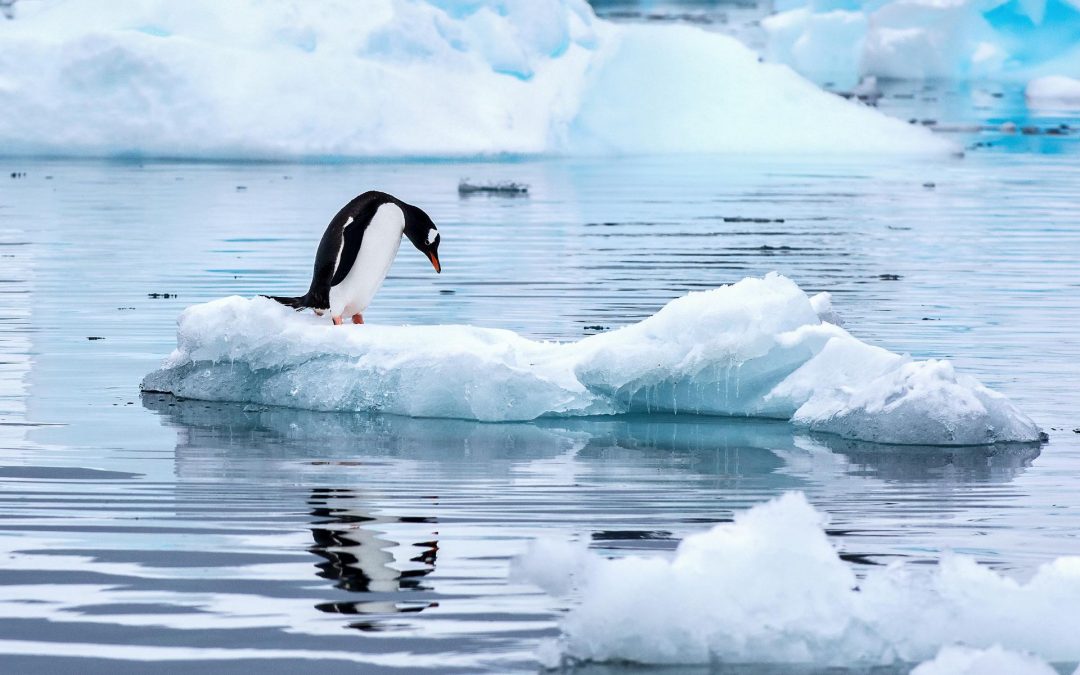
Antarctica has been suffering for years due to the high CO2 emission levels around the globe.
I have brought an expert that would be able to shed light on the matter based on personal experience and what he and his family have been witnessing for the past decades.
Please help me in welcoming Frosty the Penguin!

Frosty was born and raised in Antarctica by a family of scientists.
His grandfather was among the first penguins to witness the melting of glaciers and the family kept records of changes that have occurred throughout the years in Antarctica.
While growing up, his surroundings were changing rapidly due to higher temperatures.
The sled that he used to play at with his penguin friends has turned into water; friends from other species have already left, or even died at sea.


Today Carbon Dioxide levels are rising rapidly from 400mg/L in 2019, to 409mg/L in 2020 to reach 420mg/L in 2021 due to the burning of fossil fuels, industrial processes, and tropical forest destruction.
As a result, Glaciers are rapidly melting and Frosty is facing the danger of migration or even death.
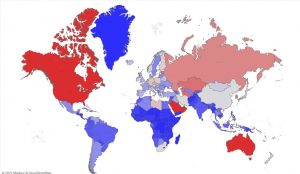
CO2 emission in 1980 started increasing drastically in countries like China going from 1.5 gigatons of CO2 to a record high of 11 gigatons in 2017!
Also, countries like Indonesia have witnessed a consistent increase in emissions while we see that Germany in gypsy blue has seen a drop in their emissions despite being the number 1 producer in Europe; they must be doing something right.
Based on his recent study in 2018, countries like USA, Canada, Russia, Australia and China are among the highest emitting countries of CO2 compared to the European Continent (excluding Russia), the African continent and South America.
For Frosty, this means that the sea ice extent which represents the area of ocean where at least 15 percent of the surface is frozen has been shrinking especially in recent years due to our negligence.
However, it is still not too late to help Frosty have his home back!!

To decrease the level of CO2 emissions, many solutions are available such as:
- Substituting car trips with bike rides or any form of public transportation.
- Apply Emission Regulations on automobiles
- Plant trees
- Switch to Clean Energy
All of these solutions are easily implemented through deploying bicycles for rent off the streets, Carpooling or using Hybrid/Electric Cars as well as renewable energy.
The cheapest and considered to be one of the most efficient ways of reducing CO2 emission is planting trees to absorb and store the carbon dioxide in the atmosphere.
We can see these reforms being applied mostly in the European continent, Eastern and Western, which lead to the decrease in the level of CO2 from 1990 till 2018 as per the World Map visualization.
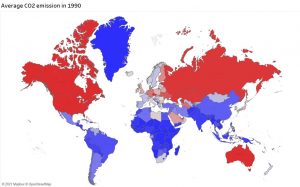
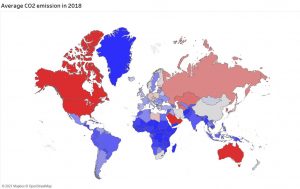
We urge countries to follow the steps of Europe and ameliorate their CO2 emissions by planting trees, adopting renewable energy and encouraging people to use lower emitting means of transportation