by hrp00 | Nov 22, 2022 | Uncategorized
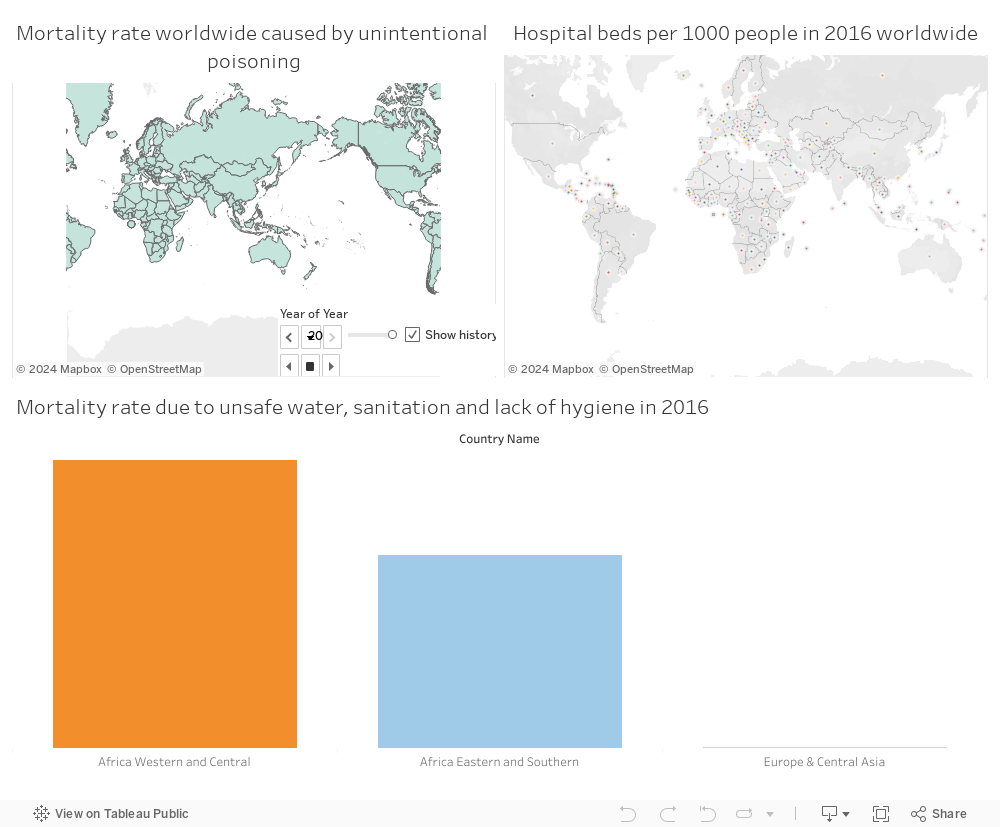
The mortality rate in Africa countries is very high compared to other countries worldwide. One cause of the mortality rate is the unintentional poisoning especially children. Because of the high poverty rate, low access to water, and high literacy rate, people are not much aware of the importance of hygenie and sanitation. This is causing a high mortality rate due to the unsafe water, sanitation and lack of hygiene. There is lot of unintentional poisoning cases in Africa compared to other countries in different continents. The problem is very serious and needs immediate response since its contribution to the overall mortality rate is high.
A response of the addressed problem is curing the poisoned case; however, the capacity in hospitals is low as the number of beds per 1000 persons is very low. Therefore, we are looking forward to solve the root problem and not only react to it. So, a good solution for the addressed problem is to increase awareness of how to avoid poisoning especially at home by the government, or related parties.
The awarness should takle these three aspects:
-How to clean food (vegetables, fruits) at home
-Filtering water with basic tools
-Right way of taking a medicine and storing it
-Right way to use chemicals or detergents and keep them away from children
More than 90% of poisoning cases are occurring at home. Therefore, starting to spread awareness of how to avoid getting poisoned at home might reduce the unintentional poisoning that is causing death. Thus, we are decreasing the mortality rate.
It’s true that we want to solve the problem from its base; however, we should also know how to provide good care and treatment for a poisoned case. This should be teached to people as first aid sessions to be eligible to approach a case and prevent the deterioration of his health or death.
by tba06 | Nov 19, 2022 | Dashboard, Team Project, Visualization
Authors: Tala Abdul Samad, Nour Al Bidewe, Basman Hariri, Sara Sadaka, Aziz Saliby, Jean-Pierre Sakr
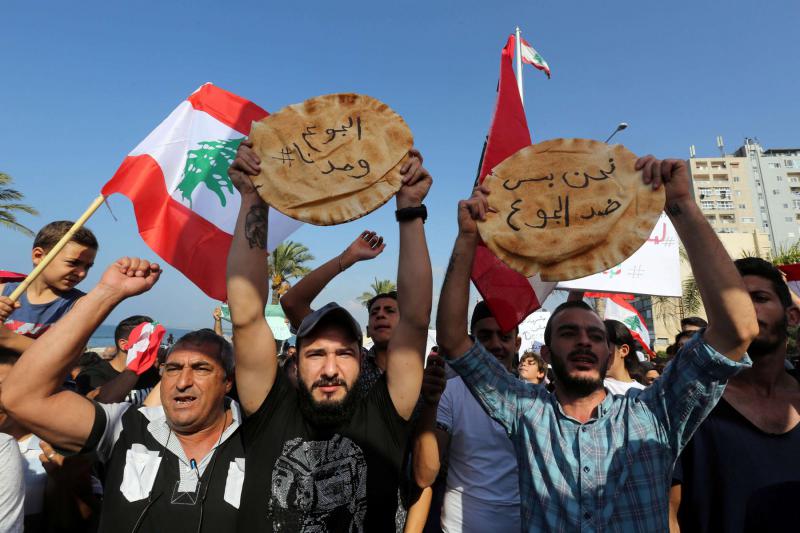
Over the past two years, Lebanon has been witnessing compounded crises such as brain drain, poverty, unemployment, and inequality. On October 3rd, we wanted to listen to the factors that affected the Lebanese the most. Borhan, a 60-year-old man living in Beirut, was one of the people we met. We captured a video with him to show the suffering of the Lebanese since the start of the crisis where he comprehensively described the severe living conditions. As we all know, 2019 was a year of transformation for Lebanon, beginning with the October 17th revolution in 2019, following the global pandemic in 2020, and the rise of inflation. Borhan expressed the feelings of most Lebanese, where he identified the problems that we are facing as residents. Many people mentioned that specific sectors have been hit the most, therefore we would like to perform exploratory data analysis and surveys using different datasets to be able to identify inequalities. We are also interested in using a data-driven approach to identify gaps and inequalities that exist in the education, income, and health sectors.
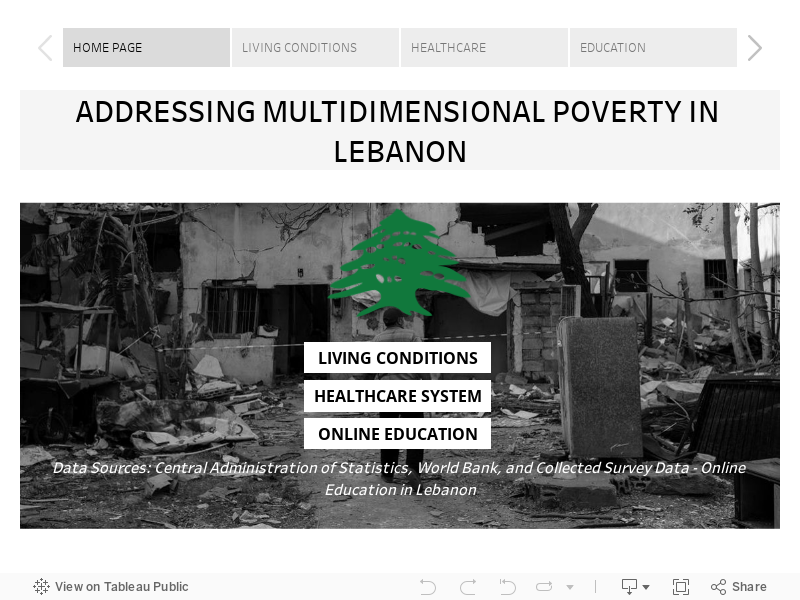
As a result, we have exploited the World Bank’s World Development Indicators and we have identified several indicators which we have used as proxies to measure multidimensional poverty in Lebanon. We chose to have a topic related to the multidimensional poverty index in Lebanon compared to the Arab region. Since the multidimensional poverty index is calculated using three different dimensions, namely education, living conditions, and health, we decided to divide the three different dimensions among us.
Living Conditions:
Housing is a significant indicator of the multidimensional poverty (MDP), and based on ESCWA calculations, the main indicators to assume whether housing is counted as depreciation for a household or not are ‘Overcrowding rate’ – the percentage of the population living in an overcrowded household – ‘Housing type’ i.e. houses, apartments, row houses, townhouses and duplexes, ‘Sanitation quality’ – availability of handwashing facilities, toilet cleanliness.
Historical data related to housing utilities in Lebanon was gathered from the Central Administration of Statistics (CAS), which contains significant indicators to measure MDP such as water, electricity, gas, actual rent, furnishings, household equipment and routine household, and others. Data is shown monthly from December 2007 till September 2022.
This data reported many indicators highlighting the increase in poverty on multiple sides. It is worth reporting that the consumer price index (CPI) Housing Utilities in Lebanon records the highest score this September 2022 (363.3) compared to October 2021 (215.9).
Looking at the nutrition level, food inflation was detected as the cost is more skewed to the right for the year 2021-2022; rising food prices reduce the purchasing power of food consumers. Another devaluation could be mentioned in the transportation sector, as the transportation sub-index of the CPI basket in Lebanon increased by 2339 points in September of 2022 (3,725), compared to August 2021 (1,386); the cost of transportation is significantly increasing, resulting in a limitation to access in the transportation sector.
It is worth mentioning that the CPI in Lebanon has more than doubled over the past year, peaking this September 2022 at a score of 1,611.4 against 714.8 in October 2021, and a higher CPI indicates higher inflation. This eventually leads to adjustments in the cost of living and income, which tends to worsen inequality or poverty as it hits income and savings harder for poorer or middle-income households than for wealthy households.
Healthcare System:
As stated by Joao Martins, MSF Head of Mission in Lebanon, “The crisis in Lebanon has been driven by years of corruption and now we are seeing that this can contribute to the destruction of an entire health system just as effectively as war or a natural disaster”. As a result, it is important to conduct a deep dive analysis on the healthcare system in Lebanon which is a dimension that measures multidimensional poverty.
First we will look at the current health expenditure (%of GDP) which takes into account the public and private health expenditure. By comparing Lebanon to the Arab World, we can notice that the current health expenditure is higher along the mid 2000 with Lebanon having 11% in 2000 while the Arab World having 4%. After that, Lebanon witnessed a decrease and the Arab World an increase reaching a value of 9% and 5%, respectively. The decrease in the expenditure in Lebanon has negatively affected the healthcare system as medication and vaccines are becoming scarce. Looking more closely, we can see in the next graph that the access to immunization has tremendously decreased in Lebanon. On average the access to vaccines (such as DPT, HepB3, and measles) has decreased from 83% (2000) to 67% (2021).
On another hand, we evaluated the demand for private insurance in Lebanon. As we can see, the demand has decreased from 70% (2000) to 45% (2021). This decrease is due to all private insurance companies converting their payment method to fresh U.S. dollars and since the NSSF benefits have diminished due to the economic crisis, most Lebanese people are now left with no proper access to health assistance.
Education:
We also conducted a survey on school and university students to analyze access to online education during the COVID-19 pandemic which was also identified as the new normal.
You can be part of our project by filling this online survey. Your answers are highly valuable to the development of our dashboard since the larger the sample size, the more accurate our results would be.
At a later stage, we would like to present our results to our target audience which are UN agencies, local NGOs, and Lebanese ministries. We got a total of 135 responses from all over Lebanon where the survey was populated via social media platforms. The majority of the respondents were university students or graduates. Most of them were unemployed or employed in a full time position.
We asked the respondents about their evaluation to their online experience; the answers rated their experience as poor or fair. On a scale from 1 being a very bad experience and 5 being a very good experience, most of the respondents rated the effectiveness of online learning as 3. In addition, we asked about the preferred type of education; the majority answered the traditional physical method as the most preferred following the hybrid method as second preferred. These answers make us conclude that the online learning experience was not that good in Lebanon. This might be due to the lack of training from the government and the teachers.
To further explore the facilities that were available to ease the online learning experience, we asked the people about their access to devices, electricity and internet. For the devices, the majority had access to devices that were mainly Mobile phones or laptops. Most of the respondents have access to electricity but not all the time while almost all the respondents have access to internet but the variance changed between access all the time and access but not all the time. Most of the respondents reflected that they couldn’t focus and they weren’t serious about their studies during online learning. Furthermore, on a scale from 1 being not at all to 5 being for sure, we asked the people about their willingness to retake the online experience. The answers varied between 1 and 2 mainly.
Finally, we asked the people about the disadvantages of online learning. Some of the responses include poor network, electricity cuttage, procrastination, weak communication, lack of motivation to study, more distraction, professors are not equipped with the resources, challenging experience for both students and professors. From this survey, we can conclude that Lebanon wasn’t prepared well for such a situation, especially its basic infrastructure which includes bad electricity and network services.
by Hadi Sleiman | Apr 16, 2022 | Generic
#SDG1 : NO POVERTY
#SDG8 : Decent work and economic growth
Most countries in the Arab region are witnessing high rates of poverty due to the poor management held by its authorities. There’s lack of economic development which is directly affecting the situation in each of the countries. There are several reasons behind delaying the growth of the economies and one of them is not understanding the real purchasing power of the consumer. In order to better understand it , countries should start evaluating their gross domestic product based on purchasing power parities rather than exchange rates.
What are purchasing power parities?
Purchasing Power Parities measure the amount of currency needed in a certain country to buy the same basket of goods and services that a single unit of another country’s currency can buy. PPPs make it possible to compare the output of economies and the welfare of their inhabitants in real terms, thus controlling for price level differences across countries.
PPPs are used for analysis and measurements in many areas by a wide variety of users, ranging from international organizations to policymakers, academia and the private sector. Due to significant differences in price levels across countries, market exchange rate‐ converted GDP does not accurately measure the relative sizes of countries or the levels of material well‐being. For this reason , we can see how the illogical health care, education and living costs in the countries are leading to poverty and unfortunate productivity.
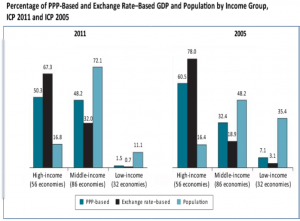
In the below visualizations we can see how the income gaps between countries have been narrowed after observing the results in 2005 and in 2011.
Moreover, in the below visualization, we can see that Egypt surpassed Saudi Arabia in having the largest economy in 2020 when we compared GDP based on PPPs.
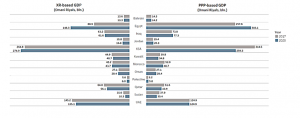
% change of GDP based on PPP between 2017 and 2020

We can see also that Egypt witnessed the highest % change in GDP with 17.63 % while Sudan observed a major decrease by 19.75%.
Recommendations:
Countries should use PPPs because it allows them to analyze their income or consumption data in globally-comparable terms by taking account of the purchasing power differences between countries.
Without PPPs, comparisons of income and consumption levels would typically rely on market exchange rates, which generally underestimate the purchasing power of consumers in poorer countries, making them appear too poor relative to those in richer countries, compared with the real differences in their living standards.
Use PPPs to set a real poverty line which describes the real deprivation level of the individual . This person is considered poor if his or her income or consumption falls below this line.