“Most air pollution comes from energy use and production,” says John Walke, director of the Clean Air Project which is part of the Climate and Clean Energy program at the National Resources Defense Council. In fact, according to the World Health Organization (WHO), it is estimated that each year, air pollution is the major cause of the death of nearly seven million people on Earth. Air pollution has several causes such as:
Burning fossil fuels
Industrial emissions
Wildfires
CO2 and other greenhouse gases emissions
According to the National Institute of Environmental Health Sciences, it is estimated that deaths due to the devastated air quality will continue to rise till 2100 and the economic value of the health benefits was estimated to be between $50 and $380 for each ton of carbon dioxide emitted.
Ever since the industrial revolution, there was an outbreak of industries in all fields ranging from mechanical production to electrical to technical. All these productions relied mostly on heavy machinery that in fact, combusted energy sources (such as fuel, oil, diesel…) and in a complex series of chemical reactions, released gases. One of those gases is Carbon dioxide (CO2). CO2 by itself is not bad because it is a needed chemical in nature. However, CO2 levels in the air have been increasing drastically to the point that they have become one of the major sources in air pollution, according to MDPI.
Carbon Dioxide from electricity production:
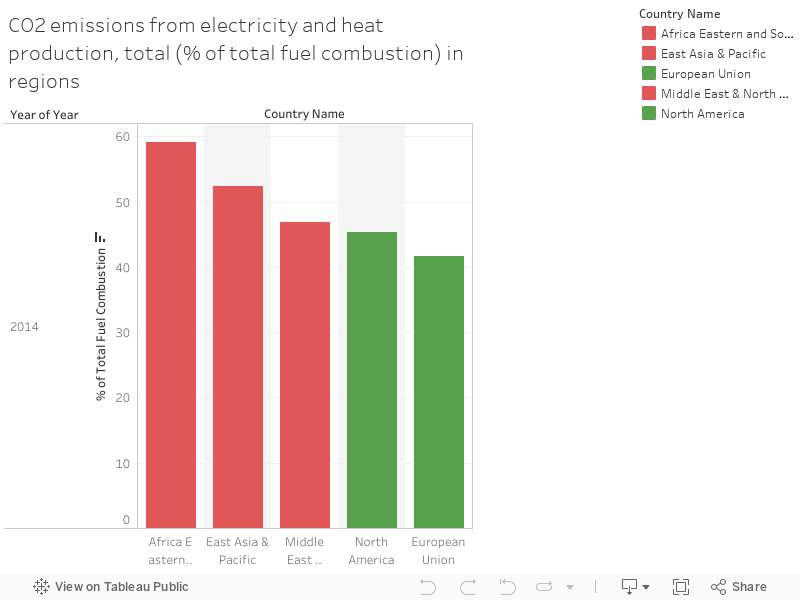
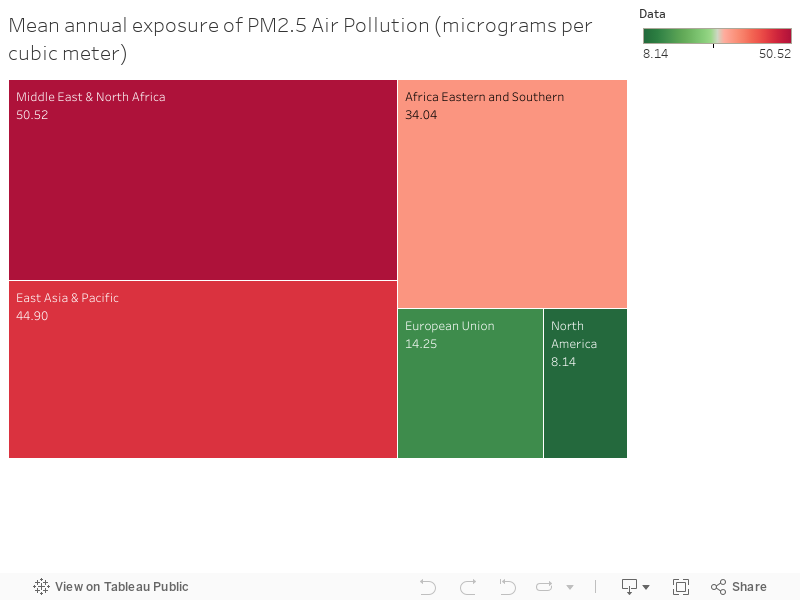
According to the World Nuclear Association, almost 40% of the energy-related CO2 emissions are due to burning of the fossil fuels for electricity production. Because a huge part of electricity production depends on burning fuels, there will be a mass of CO2 emitted to the air. This in turn leads to high CO2 emissions, especially from the countries that depend completely on burning fuels to produce electricity. The visuals below demonstrate and prove that the regions that had the highest CO2 emissions from electricity and heat production in 2014 tended to have the highest air pollution rates. The Carbon dioxide emission rates were highest in the middle east, east Africa and east Asia compared to the low numbers of North America and Europe. The same former countries had the highest air pollution rates (PM2.5) compared to the latter. Therefore, we can conclude that the higher the dependency on fuel combustion for energy production, the higher the CO2 emission rates, the higher the air pollution rates. On the long run, this can have devastating effects on the nature, climate and humans.
What can be done?
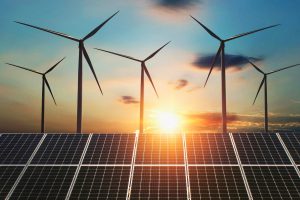
After governments realized the devastating effects of the gaseous emissions on the air quality and on humans in general, several attempts were done, such as awareness programs among the youth, restrictive laws and advertising. However, these attempts tackled the tip of the iceberg of the problem. A solution is needed to solve the problem deep from within the roots, to prevent it from happening in the first place. Producing energy from renewables could be a potential solution. The most common renewable power technologies are through Solar, wind, biogas, geothermal, low-impact hydroelectricity and biomass. According to the Environmental Protection Agency, generating energy from renewable sources reduces air pollution, diversifies energy supply and creates economic development.
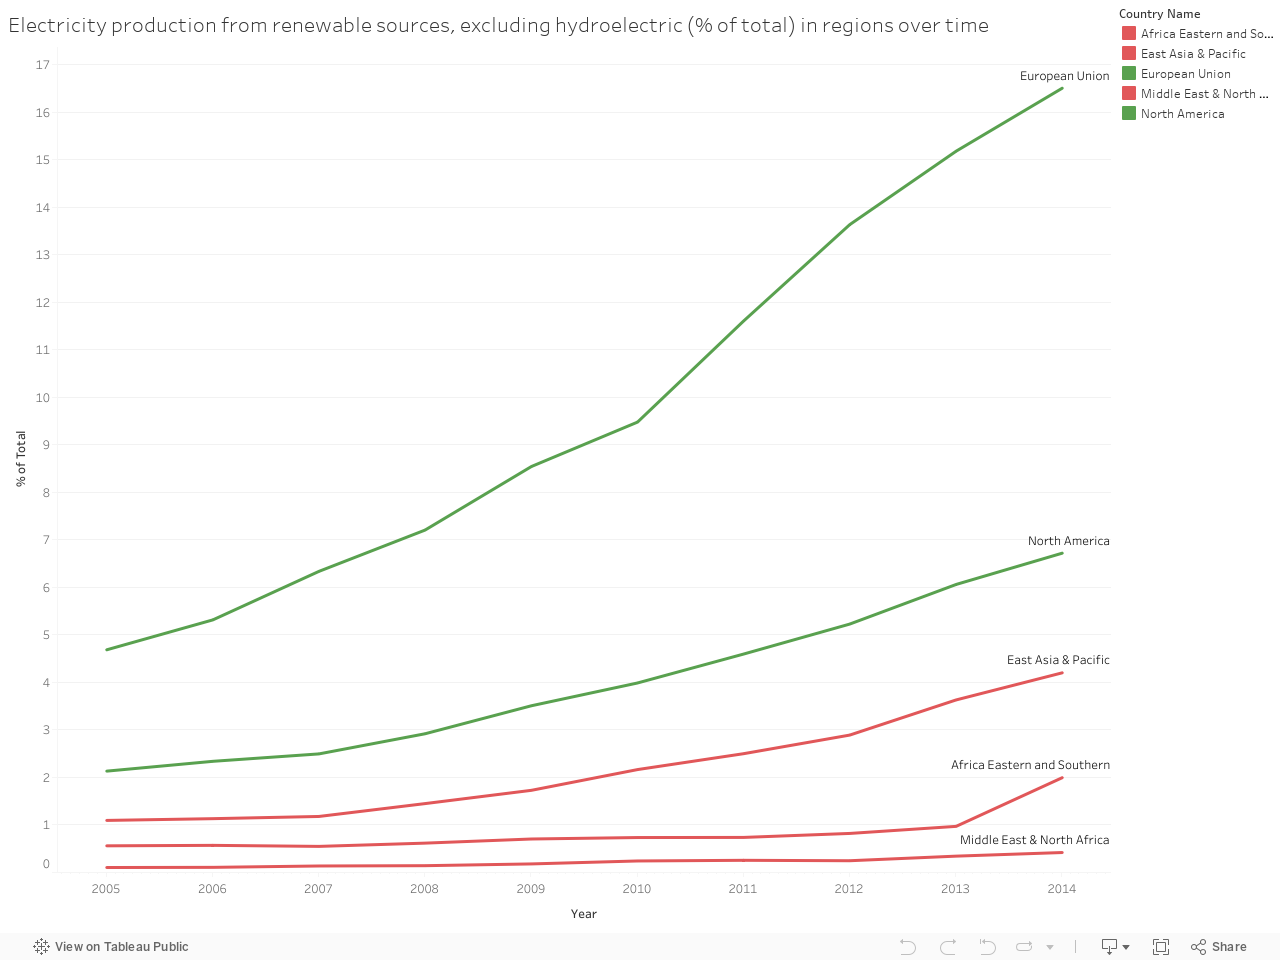
To reduce the gaseous emissions and air pollution, several countries tried to develop their technological and scientific knowledge of renewable energy production as saw a promise in using renewables, that could one day, be substituted for fuel combustion to produce energy. In fact, developed countries such as USA and the EU countries took serious initiatives to use renewable energy production. The below figures show that countries that increased their electrical energy production from renewable sources over the time period of 2005-2014 had the least air pollution rates in 2014. The EU countries and North America had the highest dependency on using renewables to produce electricity compared to the middle east, east Africa and east Asia and the former regions in turn had air pollution rates that are much lower.
Renewable energy production, therefore, is a clean energy source that can reduce Carbon dioxide emissions and in turn lead to a better, sustainable and a healthy planet that has a rich and high air quality.
The Sustainable Development Goal 3 of the 2030 Agenda for Sustainable Development is to “ensure healthy lives and promoting well-being for all at all ages”.
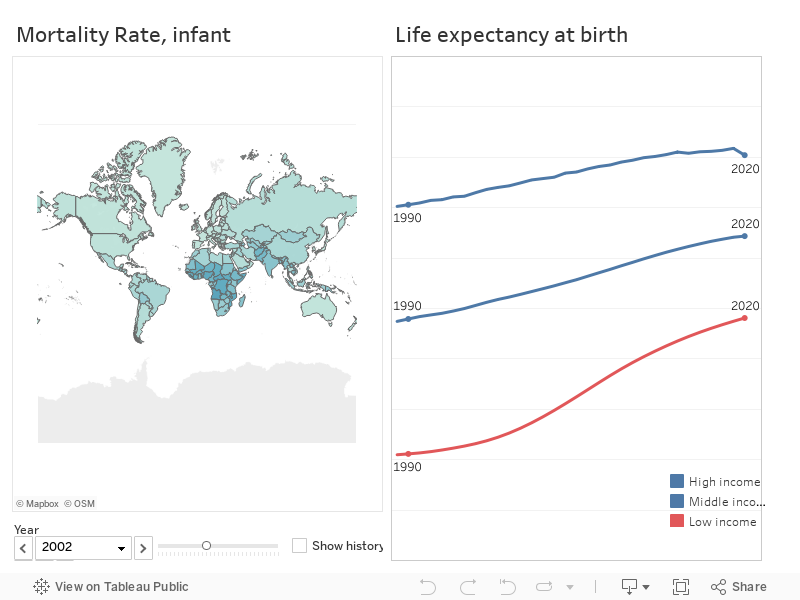
However, many low- and middle-income countries are having higher mortality rate for infant and lower life expectancy in general compared to other higher income countries.
Infant mortality is the death of young children under the age of one. The infant mortality rate (IMR) is the number of infant deaths for every 1,000 live births.
The first map shows the IMR of most countries around the world. It changes by years. From the map, we can see the global IMR has decreased from 1990 to 2021 and is predicted to continue to decrease in the future However it’s still higher in low-income countries.
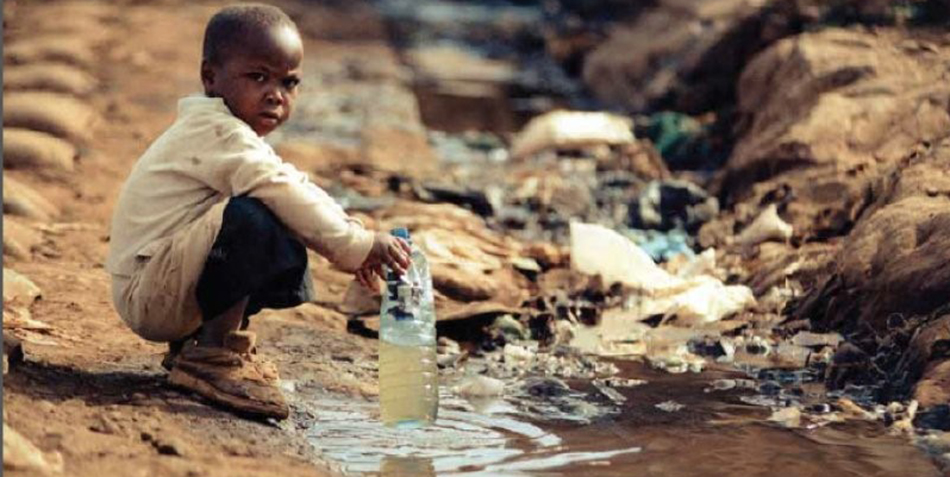
Infant Mortality Rate is an important indicator of the overall health of a society. It also reflects the social, economic, and environmental conditions in which children live. There are a number of causes of infant mortality that vary from country to country, including poor sanitation, poor water quality, malnutrition of the mother and infant, and inadequate prenatal and medical care.
Visualizing the data from the World Development Indicators (WDI) throughout different years shows clearly that there is inequality in health, clean resources and vaccination coverage as well.
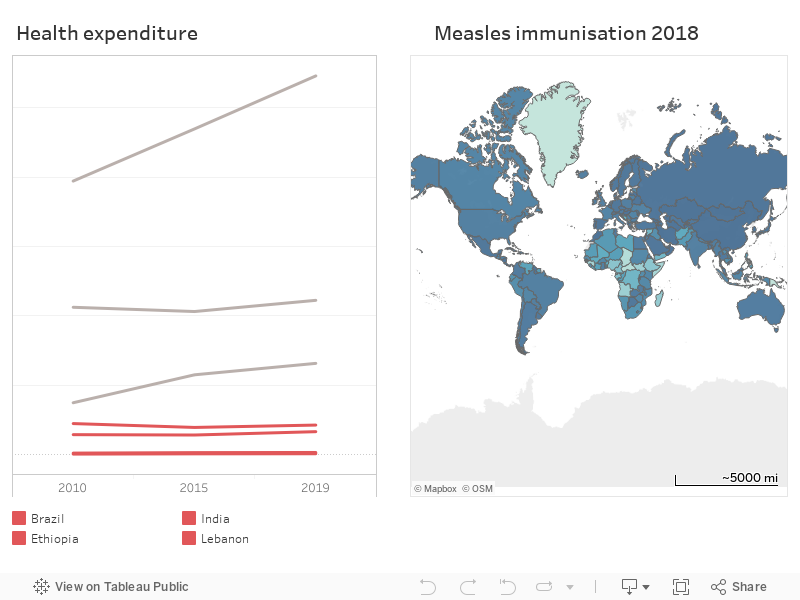
One of the main reasons for the high IMR is the lack of vaccination, taking Measles as an example, Measles is a highly contagious, serious disease caused by a virus. Before the introduction of measles vaccine in 1963 and widespread vaccination, major epidemics occurred approximately every 2–3 years and measles caused an estimated 2.6 million deaths each year.
More than 140 000 people died from measles in 2018 (over 300 deaths a day) mostly children under the age of 5 years, despite the availability of a safe and effective vaccine.
Due to gaps in vaccination coverage, in high income regions of the world such as Western Europe, measles causes death in about 1 in 5000 cases, but as many as 1 in 100 will die in the poorest regions of the world.
Another important fact to focus on is the Health expenditure per capita which is the amount that each country spends on health, for both individual and collective services.
We notice that the low-income countries have the lowest rate compared the other countries such as US and Finland.
This prevents many women of the low-income countries from getting proper and adequate medical attention due to their inability to afford good care
This is also another reason for the high Infant mortality rate in these countries because they don’t give much importance and budget for the country health system
Recommendation:
There are different causes of infant mortality that vary from country to country, including poor sanitation, poor water quality, malnutrition of the mother and infant, Vaccination and inadequate prenatal and medical care. So, in order to reduce the rate, it’s necessary to enhance the standards of living in these countries on different levels:
Measles vaccination for children, combined with mass immunisation campaigns in countries with high case and death rates, are key public health strategies to reduce IMR
Improve life conditions by providing an access to a cleaner food and beverage.
Increasing the delivery services within health facilities
Health expenditure need be prioritized by laws: Countries that have prioritized policies on health-care expenditure and have high levels of health spending are those that have succeeded in lowering their infant mortality rates
Encourage NGOs and the other organization to create projects in these countries for employability purpose and providing solutions to the people’s needs.
Validation
Monitor the world development indicators (e.g., Infant mortality rate, access to clean food, immunization, GDP,, …) in such countries over the next period and see with how much and how these indicators changed after doing these solutions.
Findings/Recommendation
Reducing mortality rate may lead to Improving labor supply resulting in improved household income and economic well-being of families and communities.
Trying to reduce inequality between high- and low-income countries will empower and promote inclusive social and economic growth
We often tend to forget that the water cycle and the life cycle are one. Millions of women and children spend 3 – 6 hours collecting water from distant polluted sources daily and 2.1 billion people do not have access to clean and safe drinking water. We live in a world where half the hospital beds are employed by patients who suffer from diseases associated with lack of access to clean water where 3.4 million people die each year.
Access to clean water in Africa on Non-Profit Organizations that offer the country a well to be used by every institution that surrounds it. Therefore, “How Can We Make Water Available for All?” is a very important topic that is being addressed through the Sustainable Development Goals.
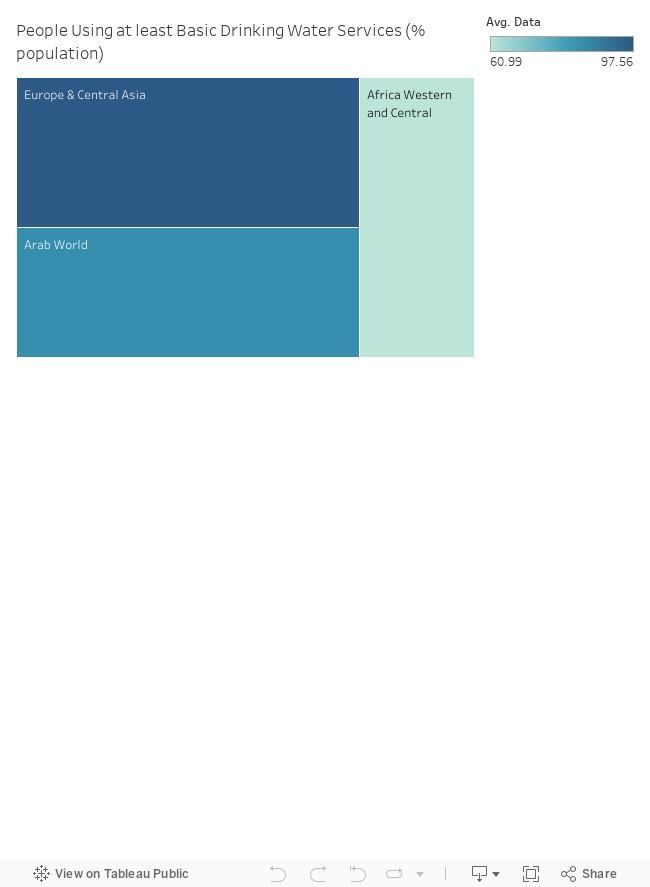
In the heat map below, we can see that Europe and Central Asia in addition to the Arab World have more access to the least basic drinking water services in comparison to Western and Central Africa.
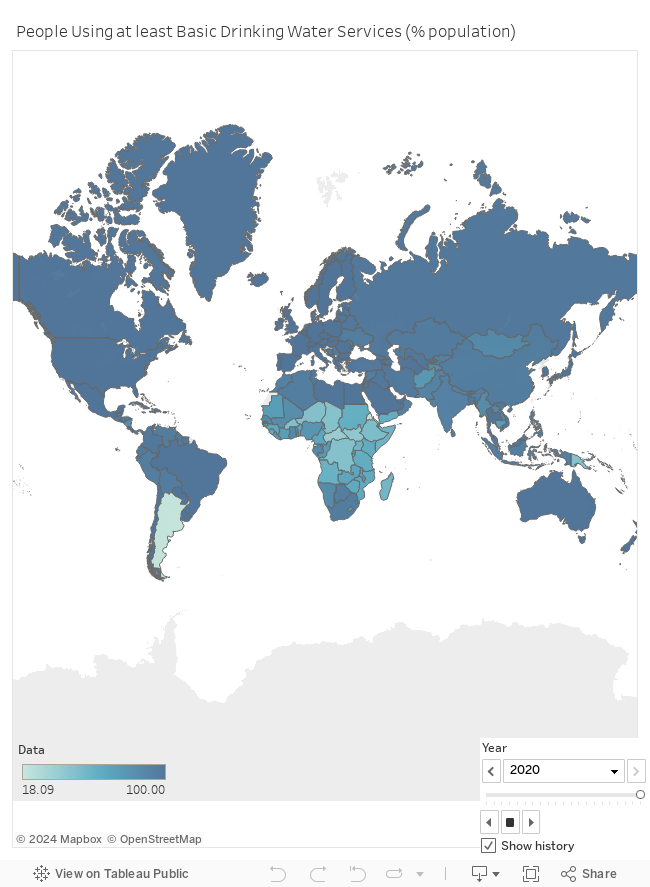
It is also evident in the visual below that throughout the years, countries from all around the world increased their intake of their basic drinking water services except African countries who show a slight improvement.
It is important to note that for you to be able to visualize the changes throughout the years, you need to press on the button at the bottom of the visual!
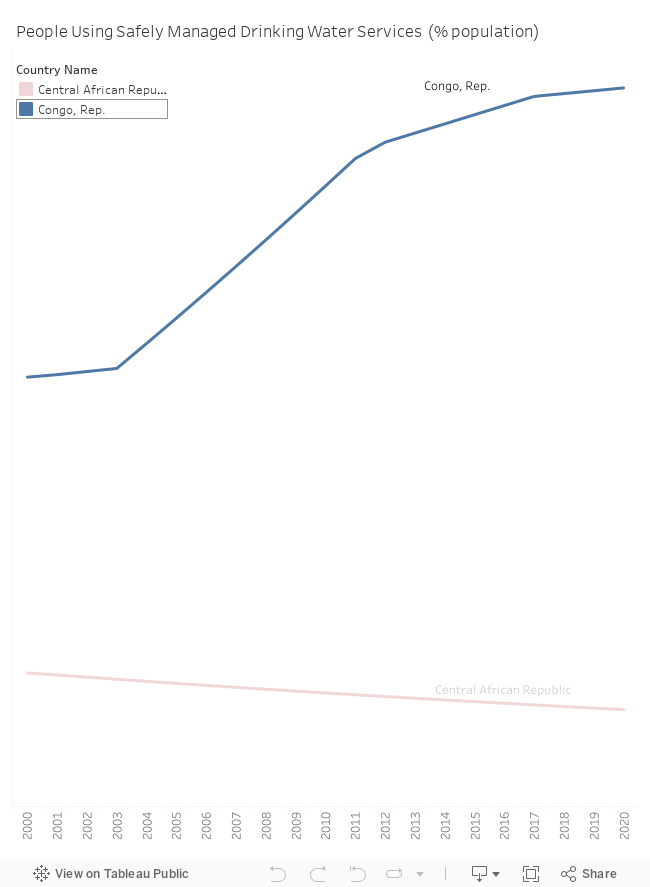
However, with the slight improvements in a few countries, we can still find that other countries (such as the Central African Republic) are still experiencing a decrease on the matter.
It is said that “Thousands have lived without love, not one without water.” – W.H Auden
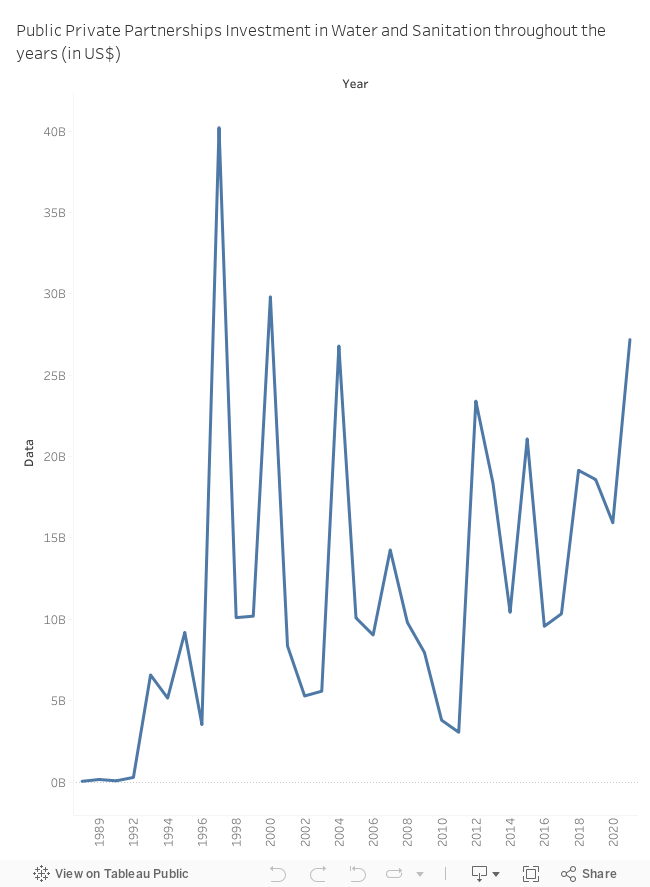
With all these problems being evident, one has to call for action. One of the solutions that have been implemented and has to remain active is increasing the public private partnerships investment in water and sanitation throughout the years (in $US).
This solution has helped increase the access of countries to clean water throughout the years and will continue to do so if implemented more often.
HOW CAN YOU HELP
You can help by donating to NGOs that offer help on the matter. Some examples on the NGOs include: Just a Drop and Planet Water Foundation. Donations can happen through
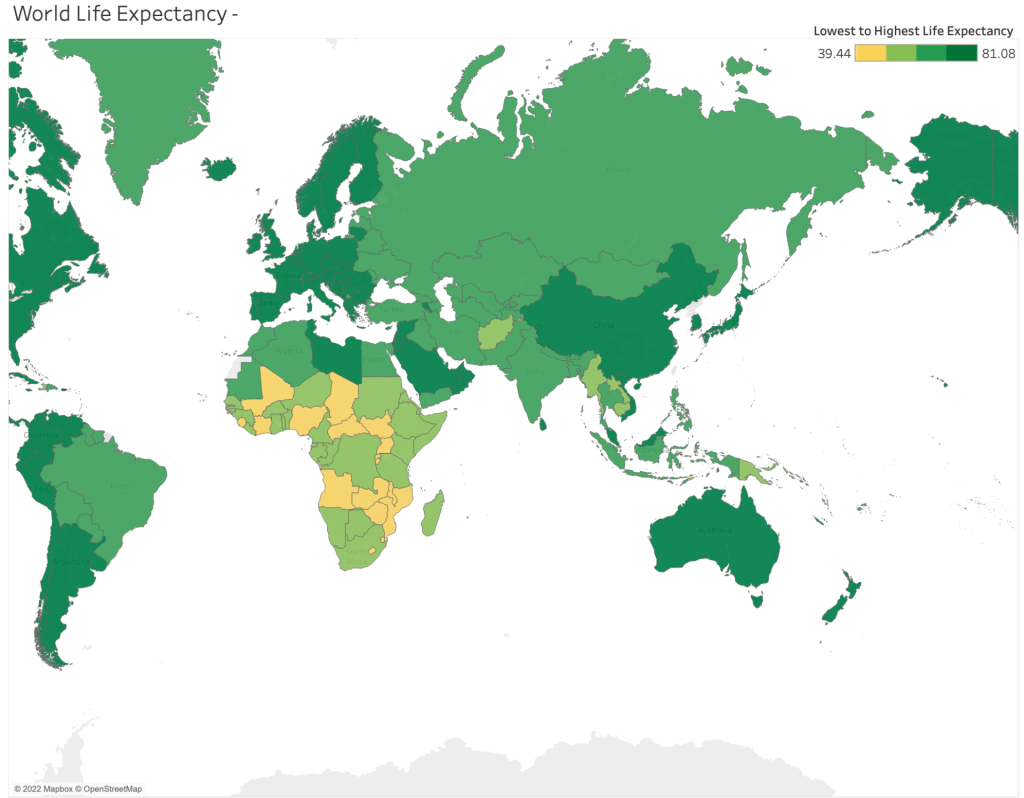
The most important statistic for measuring population health is life expectancy. Life expectancy captures mortality across the whole life course, making it more comprehensive than the restricted measure of newborn and child mortality, which concentrates only on mortality at a young age. It provides information on the typical death age for a population.
Since the Age of Enlightenment, life expectancy has rapidly grown. Life expectancy began to rise in the early industrialized nations in the 19th century, but it remained low in the rest of the world. As a result, there was a huge disparity in the distribution of health throughout the world. Good health in the wealthy nations and continuously poor health in the developing nations. This worldwide inequality has declined during the last few decades. The nations with the highest life expectancy in 1800 are the only ones in the world with a lower life expectancy today. Many nations that were formerly afflicted by poor health are quickly catching up.
The world map below shows the life expectancy of the year 2000.
African nations have been struggling with health related issues for quite some time. One of them is that, when compared to other continents, such as Europe Africa has the nations with the lowest life expectancies. Why is that? Does government health expenditure play a big role disaster?
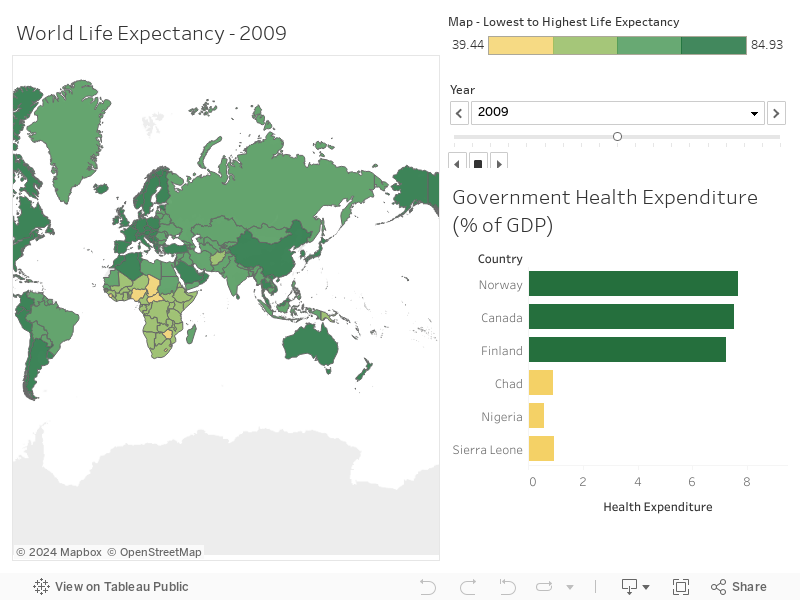
Government health expenditure plays an important role in guaranteeing people’s livelihood and in improving the quality of human capital, and it also plays an important role in affecting economic development.
In order to characterize the specific trend of government health spending affecting life expectancy in Africa, the dashboard below chart shows the expenditure in healthy sectors by the government, from years 2000 to 2018, of the top 3 countries (in terms of life expectancy) and the bottom 3 in comparison as shown in the map.
We clearly see that countries with high government expenditure have a higher life expectancy.
Even though African nations still have a low life expectancy in comparison to other countries, significant improvement has been made since the early 2000s as life expectancy within African nations has seen an increase of at least 10 years.This shows a positive relationship between government health expenditure and life expectancy.
What we can do to further help and develop Africa is to create a funded project by the UN or the WHO to help create more hospitals in the region that would be specialized in treating and aiding people with diseases.
A pandemic that is targeting the under-privilege, as if the right of living and being protected from such a disease is dependent on one’s status and unfortunate living conditions.
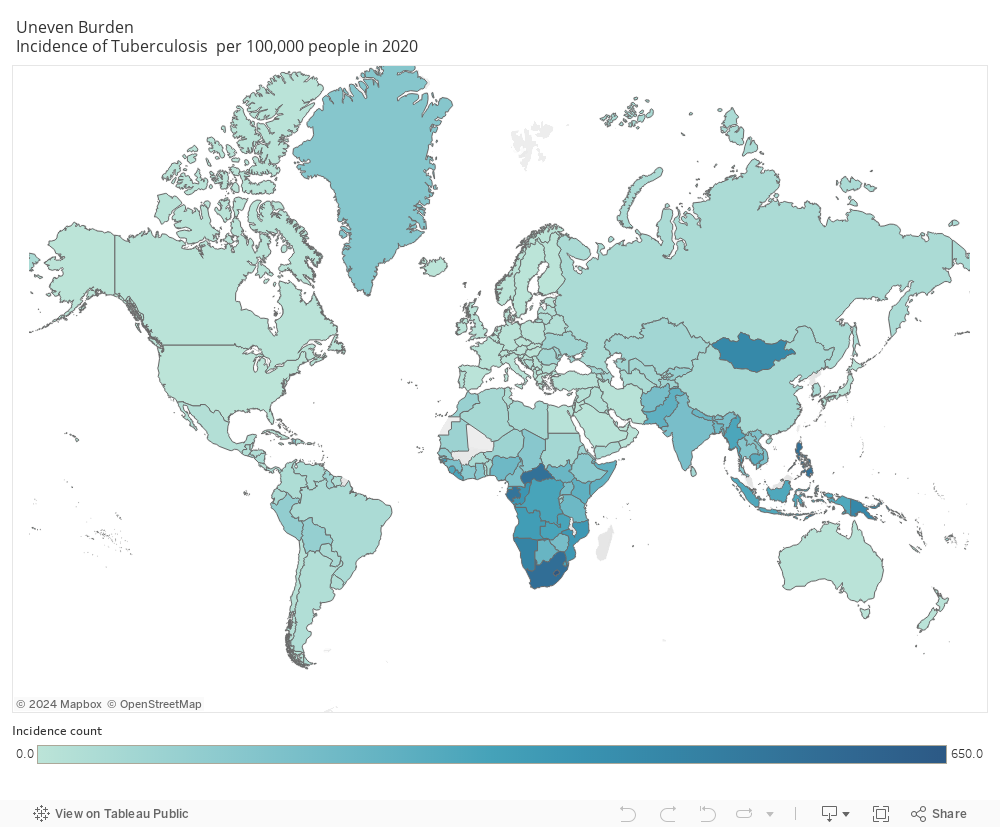
Tuberculosis continues to be a huge peril disease against the human population and according to WHO, TB is the leading cause of death in infectious diseases killing over 1.5 million people around the world in 2020 alone, 95% of which is occurring in developing country.
The below is a reflection of the data from the world data index showing the uneven distribution of TB incidence per 100,000 in 2020 that is occurring. A steady decrease in developed countries , however a remaining major problem in developing countries.
The World Health Organization (WHO), following the guidelines of the United Nations’ Sustainable Development Goals (SDGs), plans to eradicate the pandemic by the year 2030. The goal is to reach a 90% reduction rate in the number of deaths due to TB by the year 2030, and 95% by 2035.
Actions to be taken:
Allocate funding on providing chemoprophylaxis (the number one treatment for TB) to developing countries to increase access for the underprivilege and decrease spreading of TB.
Adjust healthcare policies and increase campaigns for free BCG vaccination in developing countries , making it mandatory as with many developed countries
Mass screening tests to detect dormant or active TB, to decrease spread especially with over-populated settings and among the immunosuppressants.
Increase Awareness campaigns to educate the population on the signs and symptoms and importance of preventive measures to be taken for a better chance of survival.
The key to an end of the pandemic starts with you!
I am a healthcare worker and I urge you after this blog to do the following:
Check your vaccination history on BCG, along with your family.
Educate your self with the signs and symptoms: persistent cough with bloody secretions , severe chest pain and shortness of breath , weight loss and generalized weakness , fever and night sweats
Tuberculosis may be dormant, meaning asymptomatic for years for that if you have never been tested, urgent medical screening is required.
If you experience any of the signs and symptoms , seek immediate medical help
Keep your distance when engaging in a conversation and avoid crowded places!