
by Ahmad Tekriti | May 5, 2020 | Visualization
My morning dark coffee was mixed lately with the sorrowful news regarding the collapse of the Lebanese economy. People are losing their jobs, their purchasing power, and even their hope to rise again. I felt for a couple of times that we are powerless and it’s the time to accept that hope is only a way to package the melancholic truth.
In my attempt to find any light inside the deep dark hole that we are inside, I remembered the metaphor of Lebanese phoenix that I heard about during the 2006 July war. Phoenix is the bird who can arise from the aches according to Greek mythology. Beirut, the capital of the old country, like the phoenix, was rebuilt more than seven times according to legend. So, to strengthen the glimpse of hope with actual reality, I searched for a recent stage where Lebanon was rising. I surprised when I found that between 1950 and 1974, Lebanon was in a golden stage with a GPD per capita is greater than many developed counties nowadays! So, my current concern becomes while drinking my morning coffee is how we can make the Lebanese phoenix rise again?
Note: I created this graph using tableau software based on the data from Maddison Project Database 2018.

by Jad Rizk | May 5, 2020 | Dashboard, Visualization
The below storyboard highlights and examines a correlation between the GDP per capita and population age distribution. The visualization shows a comparison between regions and across time. This correlation makes us think more about future problems like pensions, economic growth, child labor, retirement age, and possible social problems. It is worth examining further if there is causality. Are economic changes coming based on age distribution?
The dashboard is interactive. Please feel free to filter, highlight, and discover the data in more depth. The fullscreen setting will allow for a better viewing experience.
by Nourhan Mahmassani | May 5, 2020 | Visualization
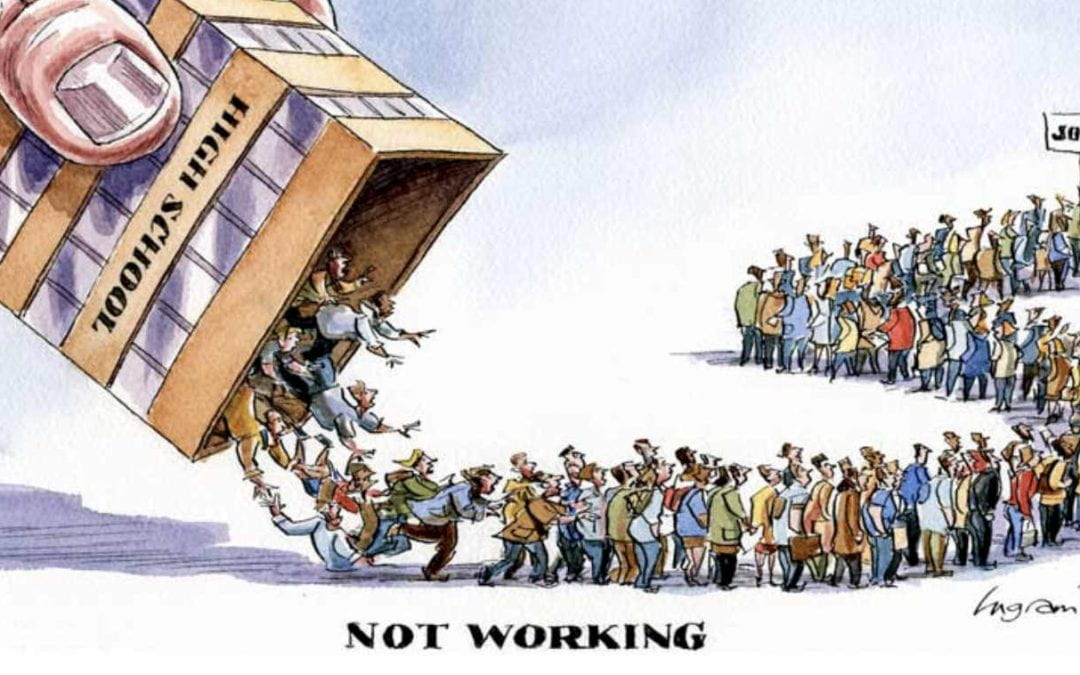
Countries face a huge loss due to unemployment. In order to find a solution for unemployment, we searched for the factors causing it. As shown below, gender discrimination, country’s GDP, distribution of jobs among the economic sectors, and educational level have a huge impact on Unemployment.Above,you can alter the regions you want to analyze from using multiple values drop-down.
In Conclusion:
-As GDP increase the Unemployment rate decrease
-Female Unemployment is higher than the males due to gender discrimination in workplace
-Employment rate is higher in the services sectors which mean that there is no equal job opportunities in between sectors causing higher
unemployment
-If the educational level is more advanced, their is lower unemployment rate
Data Source: https://datacatalog.worldbank.org/dataset/world-development-indicators
by Sari Hajjar | May 4, 2020 | Visualization
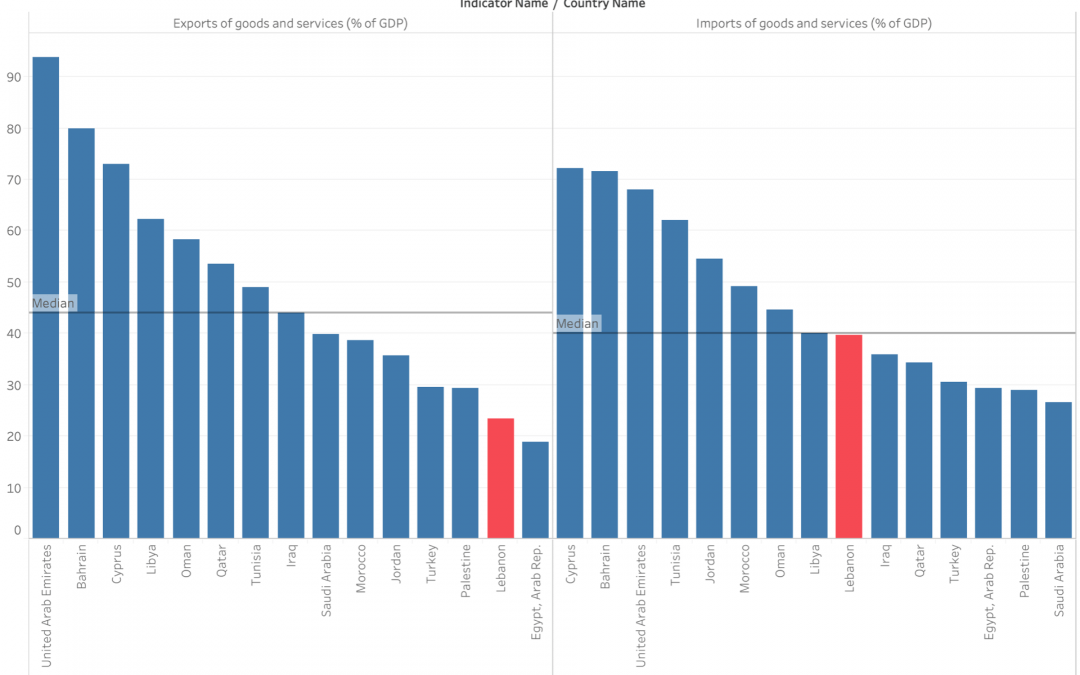
The poor economic situation in Lebanon is the result of multiple problems that led the this crisis. One of those problems is the imbalance of the exports and imports of goods and services in percentage of the country’s GDP.
It is clear that Lebanon has an export deficiency problem, with a percentage of imports double the percentage of exports, which is in turn way below the region median.