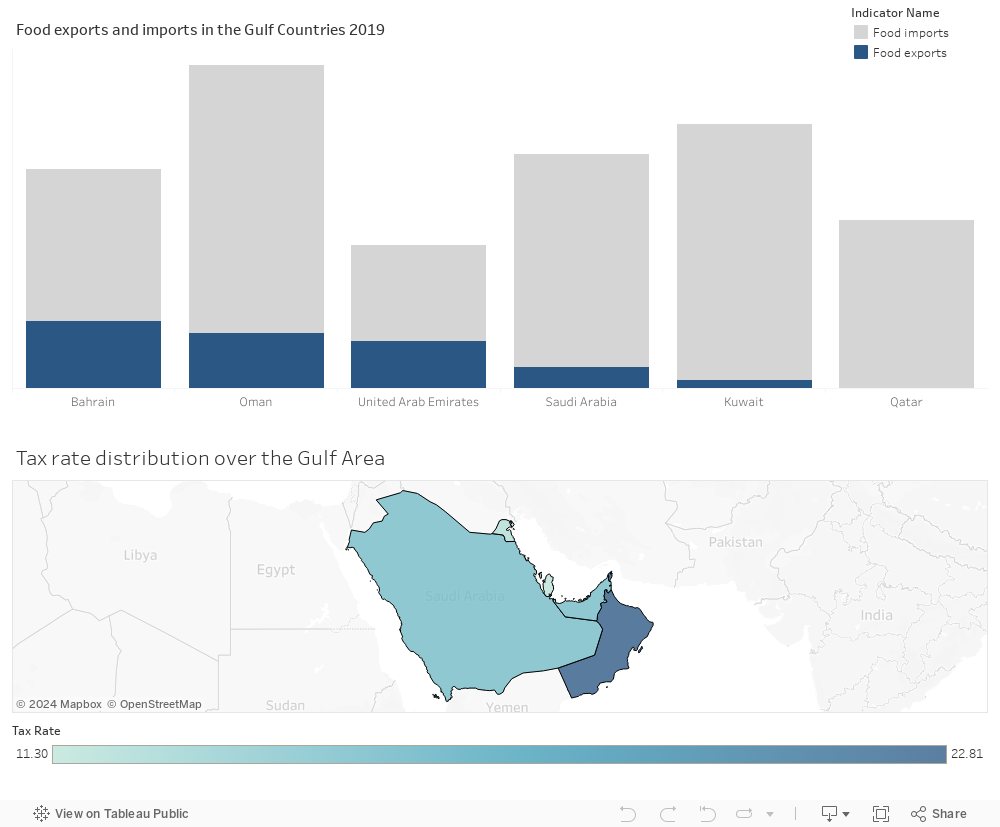
The percentage of Food export in Gulf Countries in 2019 is extremely low and the imports is relatively high comparing to exports. Gulf countries exhibited a notable disparity between food exports and imports, with food exports being exceedingly low and food imports substantially higher. Qatar, Kuwait, and Saudi Arabia, in particular, heavily relied on food imports to meet their consumption needs. This underscores a regional dependence on international food sources and highlights the importance of addressing food security to ensure stable access to essential resources in the Gulf.
Impact of Tax rate on Import and Export
The tax rates in Gulf countries as seen in the map can linked to the imports and exports, reveal an interesting correlation. Lower tax rates, such as those in Qatar and Kuwait, can encourage trade and potentially offset their low food exports and high food imports. Conversely, higher tax rates, as seen in Oman, might contribute to higher food import figures. The relatively lower tax rate in the UAE supports its role as a regional trade hub, which is reflected in its balanced import and export figures. The interplay between tax rates and trade statistics underscores the significance of fiscal policies in shaping the trade landscape of these Gulf nation
Agriculture & Industry
Influence of Water Withdrawals in Agriculture and Industry on food imports and exports
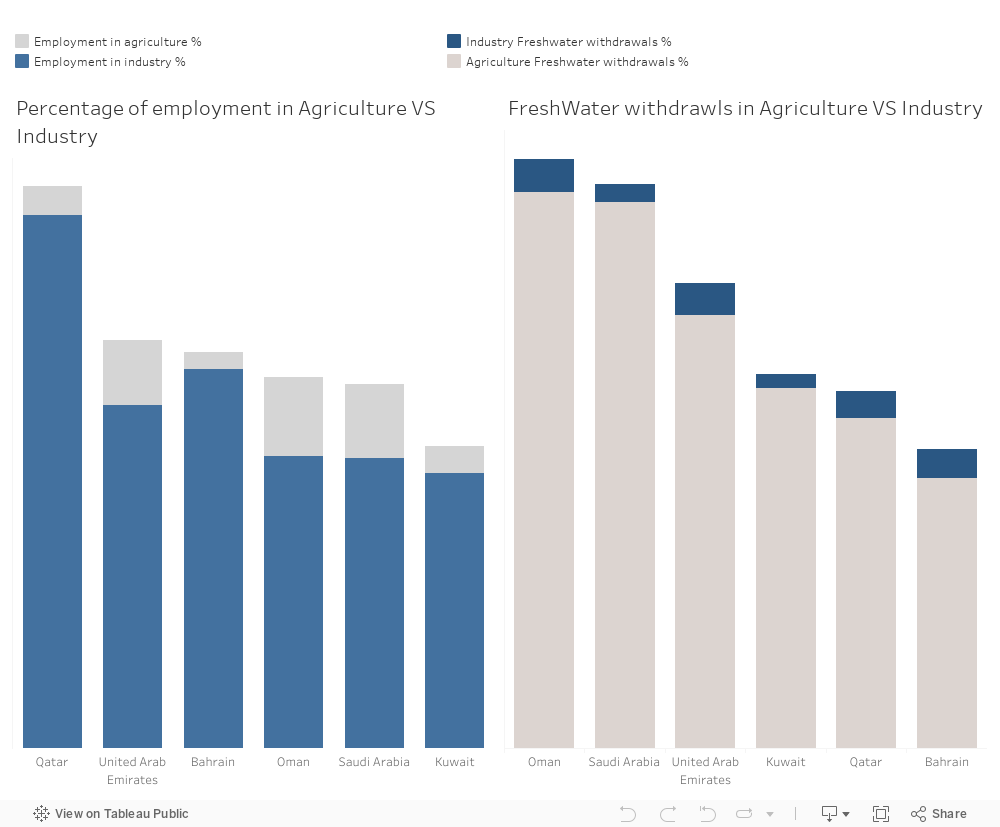
The water withdrawals data indicate the extent of agriculture and industrial activity in Gulf countries. Higher agricultural water withdrawals, as seen in Saudi Arabia and Oman, suggest self-sufficiency in food production. Meanwhile, countries with lower agriculture withdrawals, like Kuwait, may rely more on food imports. These water withdrawals can be linked to food import and export dynamics, influencing food security and trade strategies in the region.
Influence of Employment in Agriculture and Industry on food imports and exports
Higher Agricultural Employment & Food Trade:
Oman and Saudi Arabia, with higher agricultural employment, might have a more significant capacity for domestic food production. This could relate to their lower food imports and potential for food exports despite modest industrial growth.
Lower agricultural employment in Bahrain, Kuwait, Qatar, and the UAE could imply a heavier reliance on food imports due to limited domestic agricultural output, aligning with their higher food import figures.
Industrial Employment & Food Trade:
Qatar’s high industrial employment might suggest a lesser emphasis on agriculture, potentially leading to higher food imports despite economic diversification.
Other countries, with varying industrial employment rates, might showcase different levels of agricultural emphasis, influencing their food import-export dynamics.
Solutions
Investment in Agricultural Innovation: Encourage technological advancements and innovation in agriculture to boost productivity, creating more jobs and improving food self-sufficiency..
Tax Reform: Implement tax policies that incentivize investment in both agricultural and industrial sectors, promoting growth and job creation in these areas.
Education and Skills Development: Invest in education and training programs to equip the workforce with the necessary skills for employment in agriculture, industry, and other emerging sectors.
Sustainable Resource Management: Implement sustainable water and land management practices to support agricultural growth without compromising environmental resources, thereby ensuring long-term economic stability.
UN Goals
Goal 8: Decent Work and Economic Growth:
Employment in Agriculture and Industry: The distribution of employment in agriculture and industry reflects the economic structure of countries. Goal 8 emphasizes the importance of decent work and employment opportunities for sustained economic growth.
Food Import-Export Dynamics: Countries with higher agricultural employment might have stronger domestic agricultural sectors, impacting their trade balance in food. Conversely, higher industrial employment might affect the reliance on food imports due to potentially reduced emphasis on agriculture.
Tax Policies: Tax structures impact economic activities and employment opportunities. Favorable tax policies can stimulate growth in both agricultural and industrial sectors, contributing to Goal 8’s aim of fostering economic growth and decent work.
By focusing on inclusive economic growth, job creation, and enhancing productivity in both agriculture and industry, countries can contribute significantly to achieving Goal 8, ensuring sustainable and equitable economic development.
UN Goal Link – Goal 2: Zero Hunger:
Food Import-Export Dynamics: Countries with high food imports or low food exports often face challenges in achieving food security. Goal 2 aims to end hunger, achieve food security, improve nutrition, and promote sustainable agriculture.
Agricultural Practices: Stronger agricultural sectors (linked to lower food imports or higher exports) directly contribute to achieving Goal 2. Sustainable agriculture practices, as encouraged by the goal, can enhance food production and reduce dependency on imports.
Contributors: Amin Ghobar, Basilio Diaz, Daniel Raidan, Sally Harb, Stephany Said, and Wissam Malaeb.
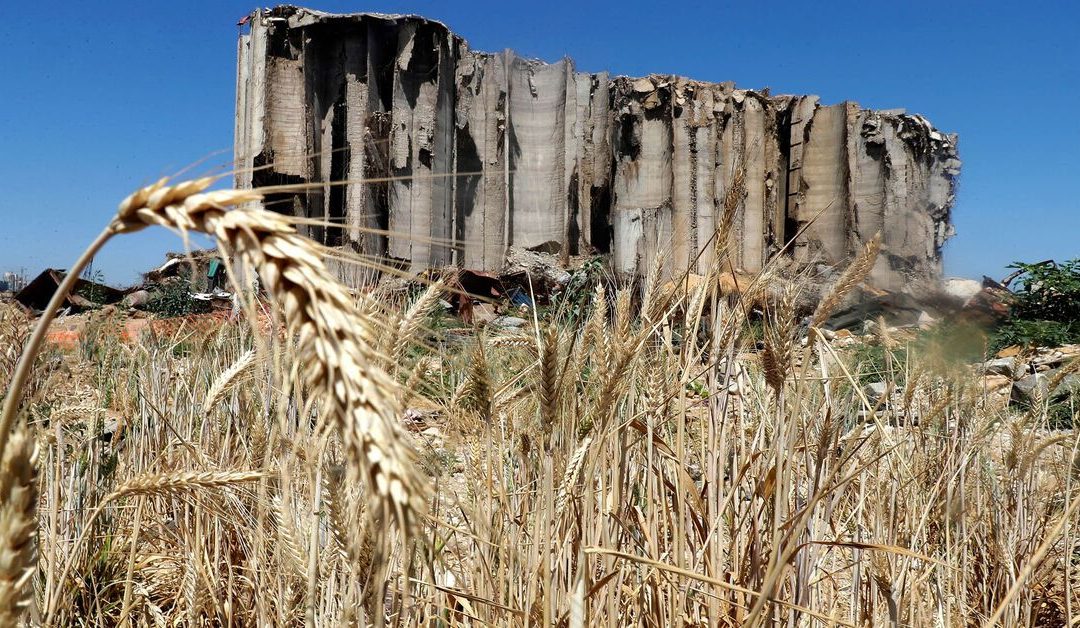
Wheat Supply and Food Insecurity in Lebanon
A principal element to boost food security in developing countries is matching the demand for wheat as it is one of the world’s most crucial staple crops. Lebanon, with almost 46% of its households being food insecure, imports around 80% of its food needs and is highly dependent on soft wheat to make Arabic flatbread.
Due to the crippling economic crisis in Lebanon, the diminishing foreign reserves to subsidize wheat imports, the Beirut Port Blast that led to the destruction of the grain silos, and the Russian invasion of Ukraine that had an effect on the supply chain and the wheat prices, Lebanon has been struggling with a negative wheat supply shock.
Lebanon’s Current Situation and the Effects on Wheat Resources and Supplies
The country is facing one of the most devastating economic crises globally since the mid-19th century. The Lebanese currency’s more than 90% value loss against the US Dollar, the inflation rate that exceeded 200%, and the grain reserves lost after the destruction of the Beirut Port – that stored around 85% of the country’s cereals with a maximum capacity of 120,000 metric tons of grain – contributed to the problem at hand. Additionally, Russia and Ukraine supply Lebanon with 70% – 80% of its wheat demand. After the invasion, wheat prices increased drastically and Lebanon, a bankrupt country, was unable to fight in the bidding war.
Moreover, the smuggling of subsidized flour and wheat to the Syrian market and the need to fulfill the nutritious needs of the 1.3 million Syrian refugees on the Lebanese grounds made the food security response an immediate priority.
In terms of Lebanon’s agricultural nature, the country relies on the import of wheat because available land that is viable for farming is not enough to meet the country’s demands and make Lebanon self-sufficient. The consumption demand in Lebanon is topped at 450,000 metric tons, and local wheat production only produces around 10-15% of such demand.
Lebanon needs to start implementing short-term and long-term fixes as the citizens are grappling to afford the increasing prices of bread in a country with a limited number of reserves.
Therefore, we came up with solutions that are divided into two levels of fixes
Short-term Fixes
Pursue avenues to continue subsidizing the price of bread. An example of that would be the “Lebanon Wheat Emergency Response Project” where a $150 million loan from the World Bank was taken that will be used in funding the imports for approximately six to nine months.
Long-term Fixes
Support farmers and develop irrigation programs to help increase local production of the wheat market up until it makes up 50% of Lebanon’s total supply. However, Lebanon can only have a 10% to 15% increase every year according to a study done by the Ministry of Agriculture. This means that it could take 5 to 6 years to reach the goal stated above.
In addition to that, rebuilding Lebanon’s national grain reserve by reconstructing the Beirut port silos and building two new storage silos nearby is another solution. This would cost $100 million and would create six months’ worth of reserves at any given time. Many countries have shown interest in helping Lebanon build those.
Finally, turning to the Ministry of Agriculture’s large and rent-free warehouses in Beqaa should be considered, as the government has been relying on private mills for storage which keeps storage levels on a day-to-day basis and paves the way for black markets. These warehouses only need some maintenance and would be ready for use.
As MSBA students, we are used to working with data daily, we are accustomed to hearing about its importance and how it holds the answers to any question we might have. We didn’t really understand how powerful data was until we were asked a question we didn’t have the answer to, and with the use of data we were able to unearth the answers to our question.
It was Monday February 22, directly after our Data visualization class, we were walking from OSB to Zaituna Bay and we were discussing different potential ideas for our upcoming visualization course when suddenly we were stopped by a SkyNews reporter. He asked us if we were students and then proceeded with asking us the one question that captured our curiosity:
Luckily, they included MSBA’s one and only Rafic Srouji in the news report the next day. His answer was:
This whole interaction got us thinking and sparked our curiosity; we wanted to find out why is the cost of consumer goods drastically increasing and what can we do about it.
As residents of Lebanon, we experienced first-hand the dramatic rise of prices every time the Lira devalues with an average inflation rate of 132.98%, so we joined the monthly inflation rate data in Lebanon with the monthly Lira rate data from 2019 till 2022. After plotting the timeseries data, we found that when the lira rate increases the inflation rate increases substantially. With further research, we found that the price of consumer goods changes substantially with the fluctuation of the lira because most consumer goods are imported, thus being purchased with the USD.
In order to get more insights about the nature of the trade deficit (exports and imports), we analyzed the Lebanese exports and imports data. This enabled us to create charts that compare the import and export values in Lebanon, and to divide them by sector.
As we can see in the dashboard’s charts, Lebanon has a large trade deficit of $12.81 Billion with most consumer goods being imported, this definitely plays a huge role in the increase of prices. If Lebanon was more self-sufficient when it comes to consumer goods and other basic products, the price of said products could potentially decrease and would be less volatile to changes in the lira rate.
Lebanon imports 20% of its total imports from the Agriculture sector, as well as 20% from the Minerals sector, which both constitutes to its highest imports. Our focus as to evaluate whether this amount could be reduced.
A big discovery was found! Lebanon has opportunities all over its area, hidden in its chaos; the country has at least one available factory that can produce goods from any tradeable sector. Lebanon has more than enough factories to reach the dream of putting a dent in the trade deficit. The country has 1,616 factories in the food industry that can dramatically decrease the high prices of food and beverages, if properly exploited.
A comparison between Turkey and Lebanon was found to be a great validation to our proposed solution. Turkey’s Lira has lost more than 70% of its value since 2021, but it was found that the inflation rate didn’t follow as aggressively as that of Lebanon. The weaker correlation between the Turkish Lira rate and the Turkish inflation rate is a direct result of the strong local production in Turkey. Turkey has a negligible trade deficit of $29 million which is negligible in comparison to its population (85 million), in opposite to Lebanon who has a trade deficit of $12.82 billion with a population of 6.83 million.
Local production is a key player in decreasing Turkey’s yearly trade deficit. Improving local production is seen to be effective in decreasing the country’s trade deficit, and decreasing the prices of goods.
From here, our findings demonstrate that there is a crucial need for local production. To do so, the government must allocate resources towards these factories and exploit them, especially in times we need them the most. This would potentially increase tourism, increase local jobs, and decrease prices all together.
The devaluation in the Lebanese currency has risen as Lebanon is suffering from the most severe economic problem since the civil war. As we know, Lebanon has huge depts. which forms over 150% of the national GDP, the third highest in the world. Adding to it, the gap between the exports and the imports of good and services in Lebanon which is widening in the recent years. Knowing that the Central Bank is providing 85% dollars for commodity imports, the US dollar is becoming scarce in the market. I can say that boosting the current economic downturn would require us to BUY Lebanese products.
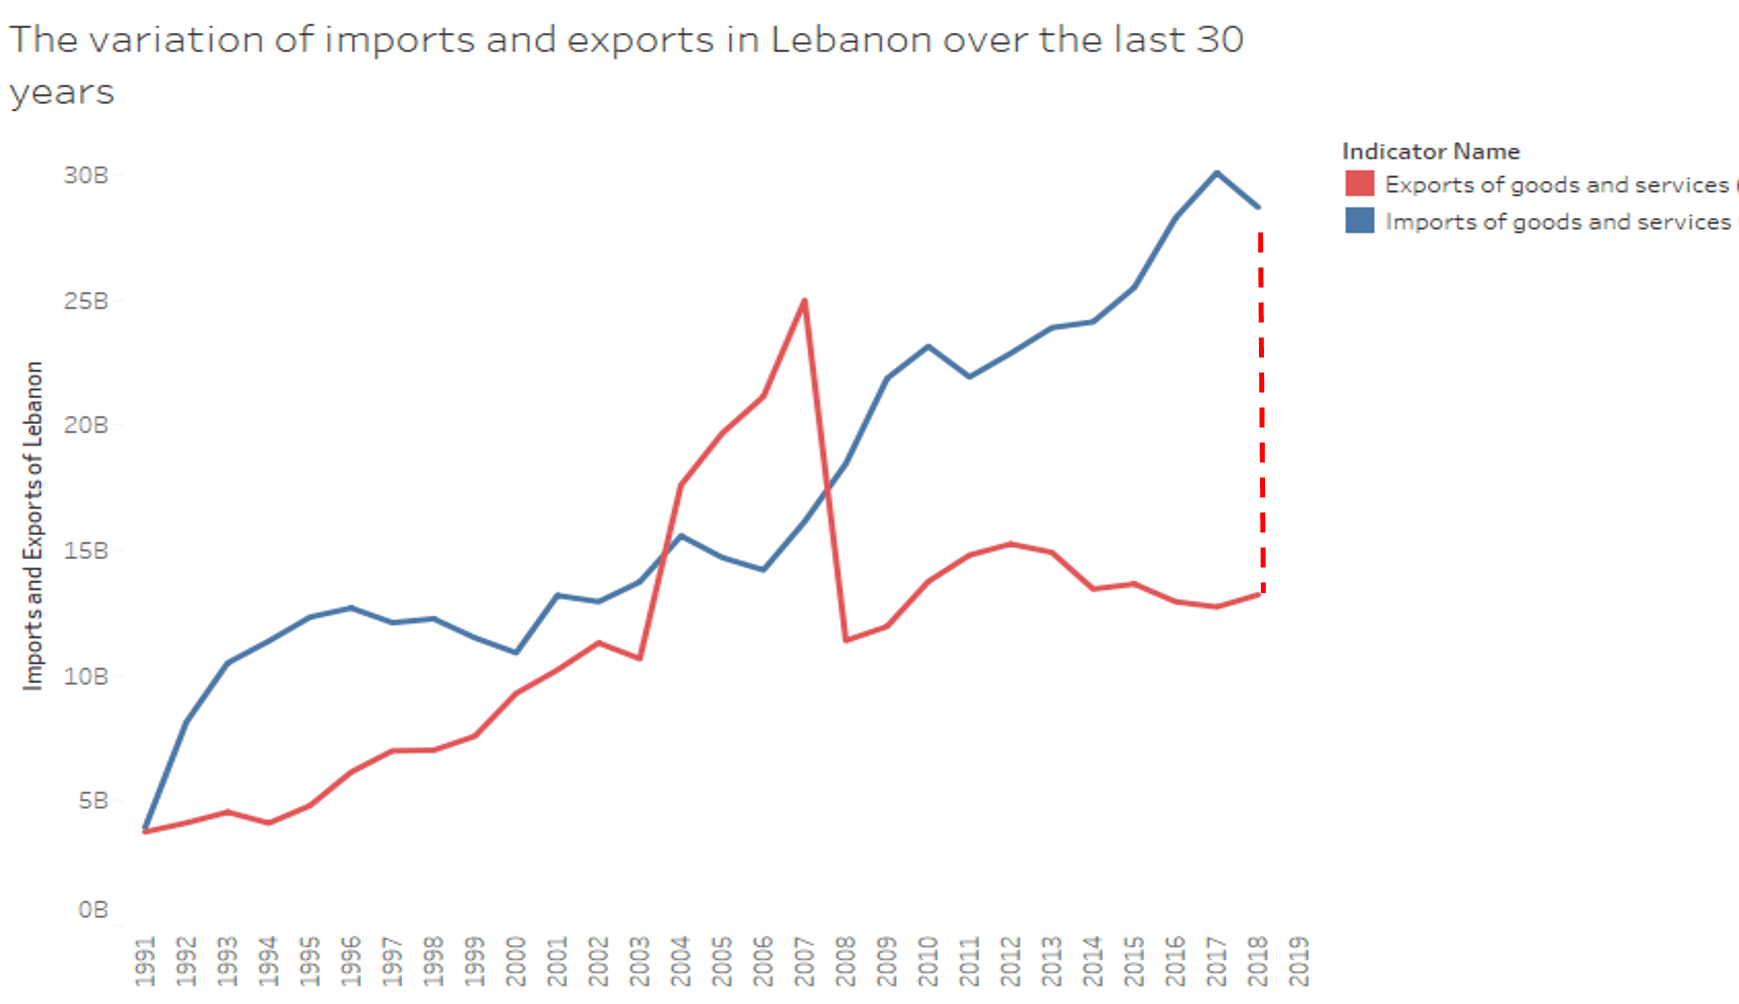
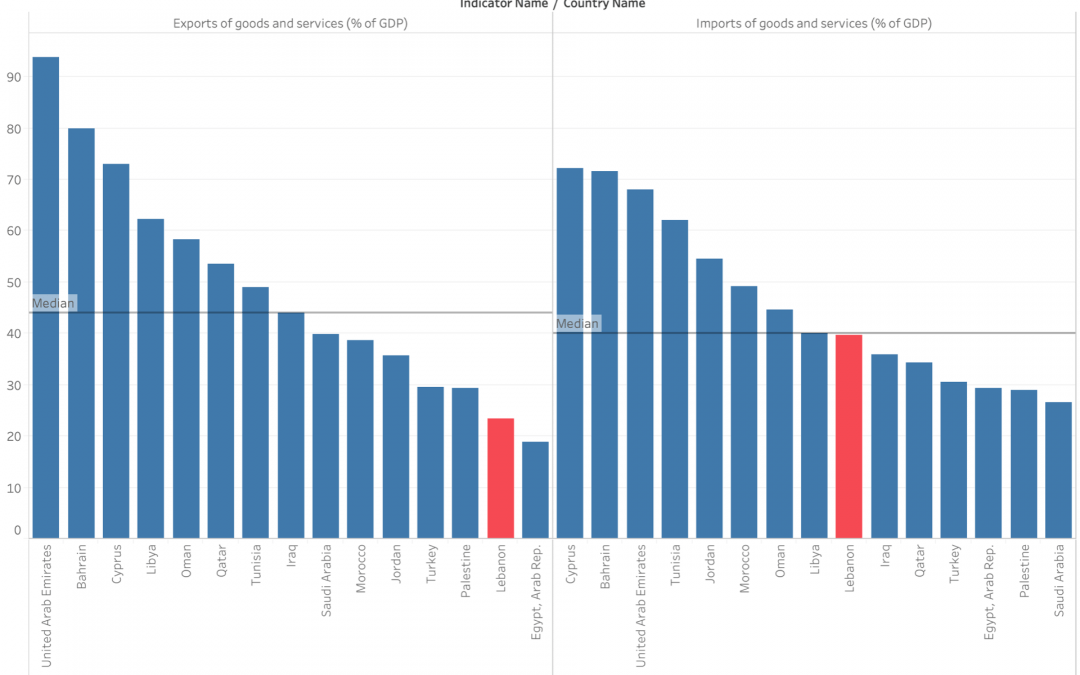
The poor economic situation in Lebanon is the result of multiple problems that led the this crisis. One of those problems is the imbalance of the exports and imports of goods and services in percentage of the country’s GDP.
It is clear that Lebanon has an export deficiency problem, with a percentage of imports double the percentage of exports, which is in turn way below the region median.