Somewhere in the hills of Akkar, a mother wakes before dawn. Her son is burning with fever, his tiny chest rising in short, frightened breaths. She wraps him in a blanket, steps outside and faces the same impossible truth every family in her town lives with:
There is no clinic here. No doctor. No nearby care.
The closest medical help is more than an hour away—if roads are clear, if transportation can be found, if nothing goes wrong. For her, and for nearly half of Lebanon’s towns, simple illnesses can become life-threatening journeys. It is not just a healthcare issue, It is a daily, silent tragedy that shapes entire lives.
What the Data Shows but the Country Ignores
The visuals map this tragedy with painful clarity.
In the bar chart:
49.74% of Lebanese towns have no local resources nor nearby healthcare.
17.08% have no local facilities but can sometimes reach distant care. Only 33.19% enjoy the basic dignity of accessible treatment.
The map shows Lebanon carved into colors that reveal the geography of abandonment.
Akkar, North Lebanon, Baalbek-Hermel, and Bekaa glow in urgent shades of red.
Beirut and Mount Lebanon rest confidently in green.
Though South Lebanon contains the highest danger percentage, it is covered with governorates that contain abundant amount of medical facilities and resources.
The visuals prove what families in rural regions already know: healthcare access in Lebanon is not just unequal—it is deeply, structurally unfair.
The danger zones are not random, they follow the borders of poverty, neglect, and distance.
A Country at a Crossroads
Yet Lebanon is not without hope. Around the world—and even within its own borders—innovative models show that remote and underserved communities can receive consistent care. The country stands at a crossroads where solutions are known, feasible, and within reach.
Lebanon can choose a future where no mother must gamble with her child’s life because of distance.
That future begins with a hybrid healthcare access model designed for real Lebanese terrain, real Lebanese families, and real Lebanese limitations.
Building the Path Forward
The path unfolds in two phases—immediate relief and lasting transformation.
Immediate Relief
Mobile clinics traveling weekly into remote towns.
Telehealth services connecting residents with doctors online.
Community health workers offering first aid, monitoring chronic diseases, and stabilizing emergencies.
These solutions bring healthcare to the people, rather than asking the people to chase it.
Long-Term Transformation
Expanding rural Primary Healthcare Centers (PHCs) in governorates painted red in the danger map.
Incentivizing private and nonprofit partnerships to open satellite clinics.
Improving transportation links so that even without a local clinic, emergency care is reachable.
This approach does not just fill gaps, it builds a system where every town becomes medically reachable, no matter how far, no matter how rural.
Why This Will Work
Proof already exists.
Organizations like MSF, the Lebanese Red Cross, and multiple NGOs have successfully delivered mobile and remote care across Lebanon’s hardest-to-reach regions. Telehealth has grown worldwide, saving millions in rural communities and the data that drives these charts, maps, and analyses pinpoint exactly where interventions must be prioritized.
The strategy aligns with Lebanon’s national health vision and mirrors international best practices in countries with similar geography and instability.
It is not theory. It is tested, validated, and realistic.
Beyond the Diagnosis
The visuals do not simply highlight shortages, they illuminate where change must begin.
The Truth
Lebanon’s healthcare inequality is regional and predictable, not accidental.
Rural northern and eastern regions are in critical danger, lacking both local and nearby care.
Nearly half of Lebanese towns face severe accessibility barriers.
The Solution
Deploy mobile and telehealth clinics immediately to stabilize high-danger governorates.
Invest in long-term PHC expansion to ensure durable access.
Integrate transportation and healthcare planning, recognizing that distance is often deadlier than disease.
Maintain data-driven monitoring to continuously reallocate resources to evolving needs.
If Lebanon acts now and not later, the red zones can fade. Families can breathe easier. Lives can be saved.
A Different Dawn
One day, perhaps, a child in Akkar will still wake before dawn—but instead of gasping for breath, he will leap from bed to greet a new school day. His mother will no longer fear the distance to care.
Because care will finally be within reach. Because the map will no longer define who survives and who struggles. Because Lebanon will have remembered its forgotten towns.
That is the story the data tells. That is the story this country can still rewrite.
“We are alive the most when we are faced with adversity like no other.”
Lebanon’s service sector should be a national strength — tourism, education, banking, and professional services once made the country a regional hub. But when we look beyond assumptions and into the data, a very different story appears: for 21 straight years, Lebanon has been in the red, importing more services than it exports.
From telecoms and travel to banking and consulting, services play a key function in transforming a country’s economic strength. But for Lebanon, the story hidden in the data tells a completely different reality—one of a consistently growing services deficit over the last two decades.
Looking at 20 years of trade data, I examined how Lebanon’s services balance transformed across key economic periods. The story became immediately clear:
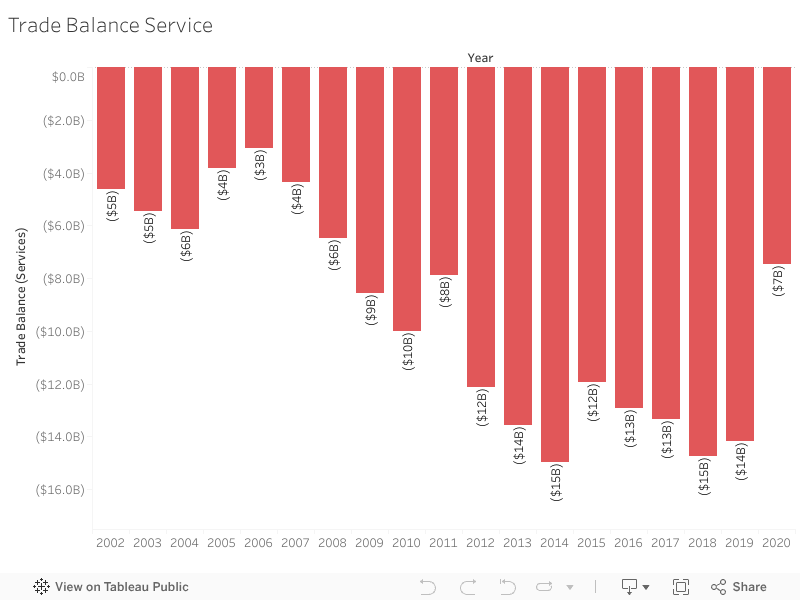
For 21 consecutive years, Lebanon has never escaped a services trade deficit, and the gap continues to deepen.
Why This Matters
For more than twenty years, Lebanon has faced a continuing services trade deficit. The country’s imports, including finance, logistics and professional consulting, have consistently exceeded its exports. The ongoing imbalance heightens economic vulnerability and increases Lebanon’s reliance on foreign service suppliers.
Between 2002 and 2022, the trade balance remained consistently negative. During its 2014-2018 peak, the trade balance deficit surpassed $14 billion, revealing how deeply rooted this issue has become.
The visualization below highlights how this deficit has evolved across key periods.
**Interactive Visualization:**
Hover over the bars to see exact values for each year.
**Full View:**
Complete visualization showing Trade Balance Services from 2002-2022.
During the pandemic in 2020, the deficit slightly decreased—mainly due to reduced travel and service utilization. Unfortunately, this improvement is temporary. In 2021 and 2022, the deficit rises again, continuing the very trend Lebanon has struggled with for years.
What This Means
A persistent services trade deficit highlights structural vulnerabilities. It reveals that Lebanon is consistently spending more on imported services than it generates from exports. With time, this imbalance becomes a financial burden that weakens financial stability and increases dependence on external inflows.
The Big Idea
Examining two decades of data highlights how Lebanon’s service trade deficit has continued to expand, revealing Lebanon’s economic vulnerability. The figures are striking on their own, but when presented as a story, the patterns become impossible to overlook.
What Can Lebanon Do?
Reducing the services deficit requires structural changes rather than short-term fixes. Strengthening digital services, tourism, and healthcare exports can create new revenue streams. Supporting export-oriented SMEs — especially those providing regional outsourcing services — can also help Lebanon compete more effectively.
Policy efforts should focus on promoting digital transformation, encouraging service-based startups, and building stronger regional trade partnerships. Over time, these measures can help diversify Lebanon’s export base, reduce dependency on imported services, and move the country toward a more sustainable trade position.
For example, Lebanon’s IT outsourcing sector—especially remote consulting and digital services—has grown naturally since 2020 and can become an export engine if supported through training and regional partnerships.
When Tom, a first-time tourist, arrived in Lebanon, he prepared a long list of places he wanted to explore: Beirut for its vibrant nights, Batroun for its beaches, The Cedars in the North for hiking and natural beauty… But as he planned his trip, something stood out: Mount Lebanon barely made it onto his itinerary.
Tom is not the only one. Many tourists overlook Mount Lebanon even though it contains some of the most visited and populated towns in the country.
This led to an important question: If Mount Lebanon has so much to offer, why isn’t it a tourist favorite?
Mount Lebanon has the most to offer.. on paper:
Mount Lebanon is home to:
The largest number of towns in Lebanon (381 towns)
The highest number of cafes, restaurants, hotels and guesthouses
Many natural and cultural attractions that are spread out throughout its towns.
As the below map shows, 25% of towns in Mount Lebanon have at least one attraction.
So one would naturally expect that Mount Lebanon is one of Lebanon’s top tourism destinations.
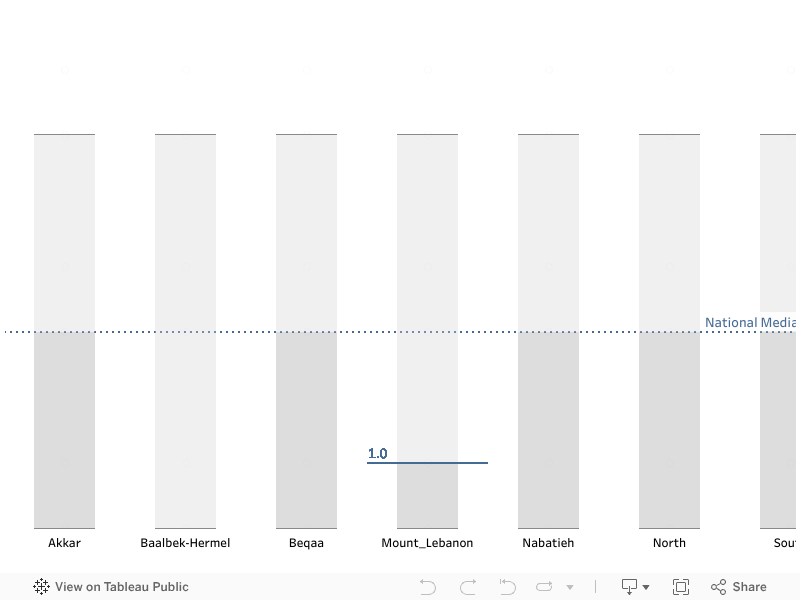
2. Despite These Advantages, Mount Lebanon Underperforms
Mount Lebanon’s median index is below the national median, meaning half of its towns score 1 or less on the tourism index.
3. Access and Public Spaces Matter More Than Attraction Count
To better understand what drivers tourism performance, I examined how infrastructure quality relates to tourism.
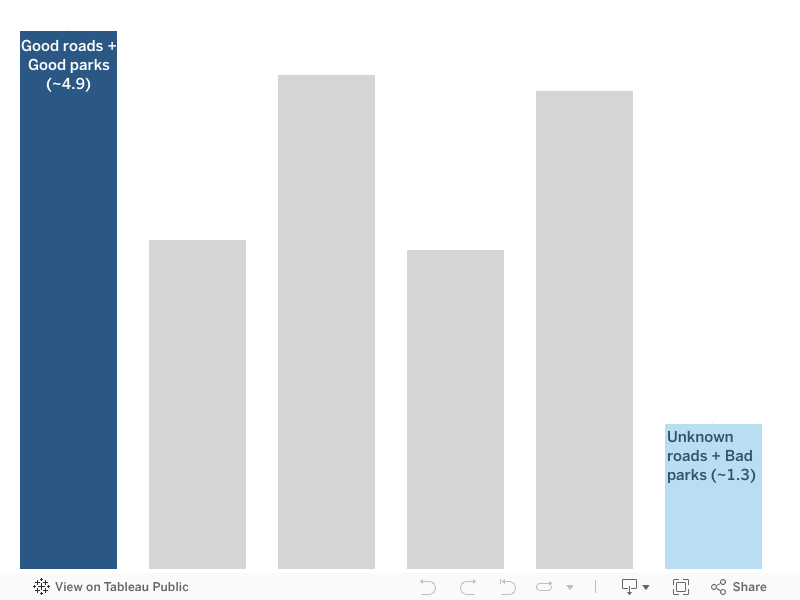
In the below graph, the pattern becomes clear: Good Roads and Good Public Spaces Lead to the Highest Tourism Levels
Towns with:
Good roads + good parks -> highest tourism indices (~4.9)
Bad roads + poor parks -> lowest tourism indices (~1.3)
This suggests that tourism thrives when attractions are easy to reach, and public spaces are well maintained.
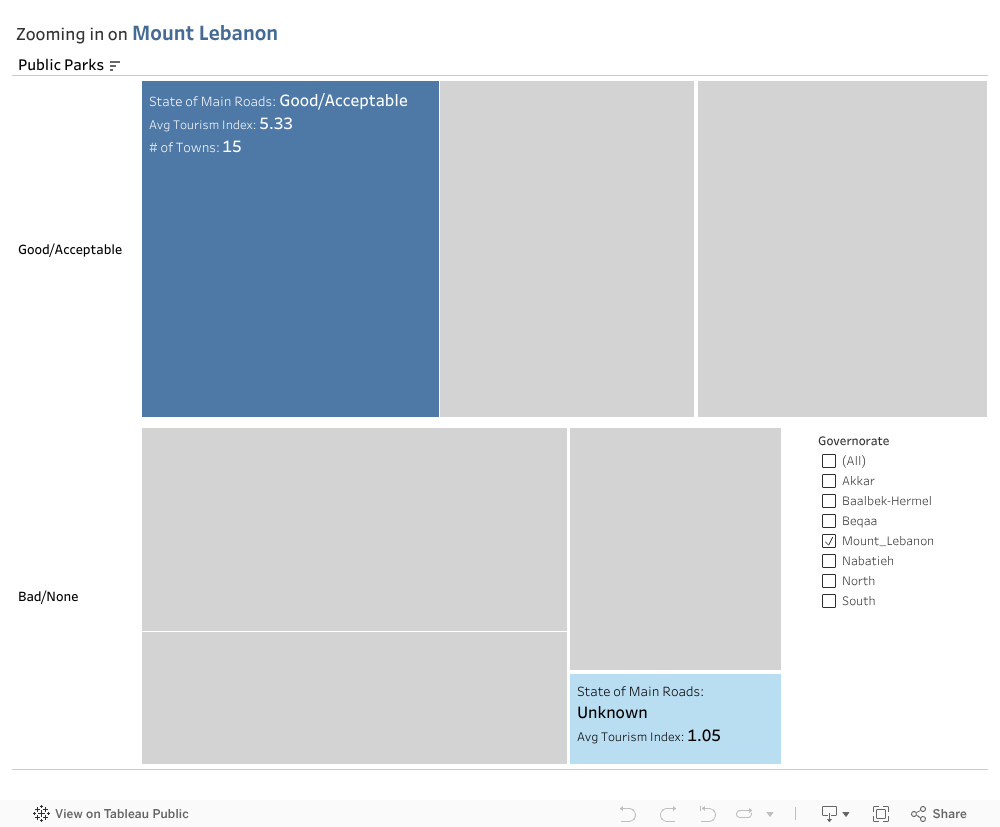
So now if we focus back on Mount Lebanon, we can see that:
Many towns have bad or unknown road conditions
Public parks are often missing or poorly maintained (these are the towns scoring above 5 on the tourism index)
This confirms that Mount Lebanon’s low tourism index is driven by poor infrastructure, not a lack of attractions.
4. Conclusion: Improving Tourism Starts With Improving Access
Mount Lebanon already has the attractions it needs. What it’s missing is the infrastructure that allows visitors to reach them easily and enjoy them fully.
5. Recommendations
To unlock its true tourism potential, Mount Lebanon should focus on:
Prioritizing road and park restoration in Mount Lebanon’s key touristic towns
Investing in accessibility and maintenance rather than only promoting attractions
If these things improve, Mount Lebanon won’t be an afterthought anymore. It will become a place Tom and countless other visitors choose to explore.
Big Idea:
Tourism performs best where attractions are supported by good infrastructure.
If Mount Lebanon wants to improve their tourism index, they should not only depend on having interesting places to visit but also invest in their infrastructure quality, as tourism thrives when attractions are easily accessible, which enhances the overall visitor experience.
In Japan, it is common for businesses to rely on the belief that well-crafted, reliable products can sell themselves without heavy marketing. One small online furniture shop followed this philosophy closely, focusing on quality materials, clean design, and dependable service rather than advertising campaigns.
The approach worked.
Orders were steady, reviews were positive, and most furniture categories- including chairs, shelves, bookcases, and storage units- consistently generated profit. By all traditional indicators, the business was healthy.
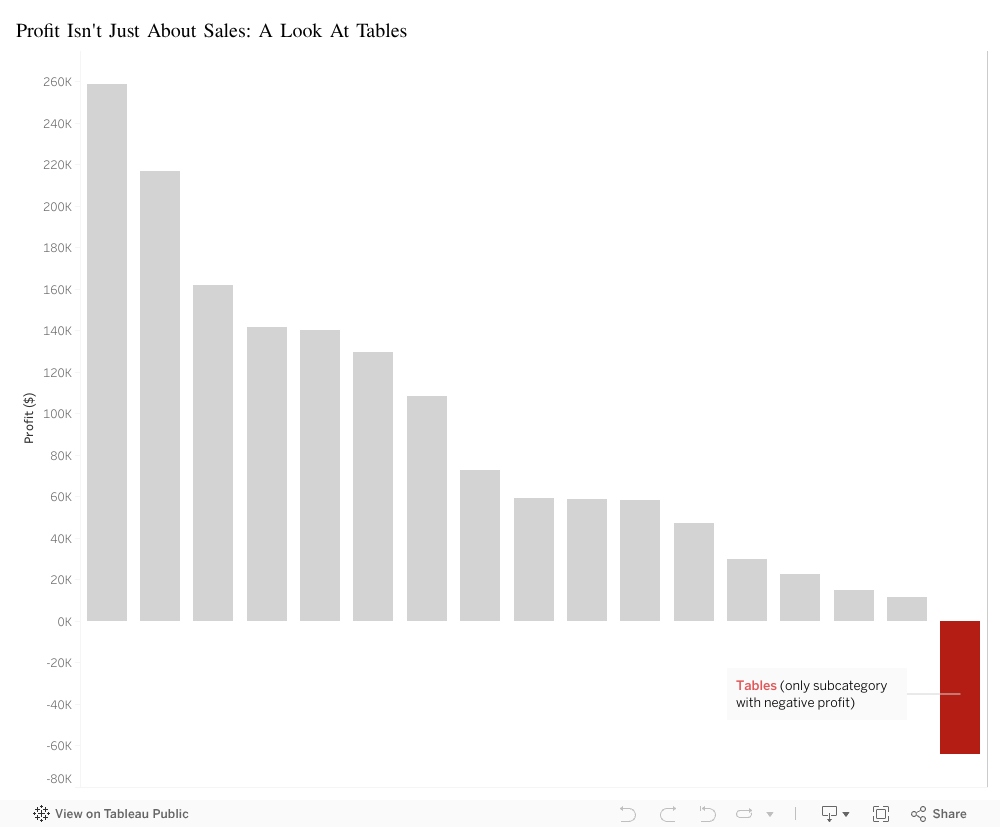
Yet something remained unusual: despite growing revenue, overall profit growth was slower than expected. The business was performing well, but its profitability did not scale proportionally with sales. This discrepancy prompted a closer look into where exactly profit was coming from, and where it might be slipping away.
To investigate the issue, a visualization was created to compare profit across all product subcategories. The results were striking. Almost every bar on the chart showed positive profit. Except one.
Tables: -$64,083.
The only unprofitable subcategory in the entire catalog.
This finding was particularly surprising because tables were not low-demand items; in fact they were bestsellers. From a revenue standpoint, tables performed extremely well.
However, when analyzed beyond the point of sale, the underlying issue became clear. Tables carried significantly higher operational costs than any other category:
They required two delivery workers due to their size and weight
They were difficult to deliver in most Japanese apartments with narrow hallways and small elevators
They consumed significant warehouse space because of their bulky shape
They were more prone to scratches or delivery damage, leading to replacements and refunds
In short, tables were profitable at the moment of sale but unprofitable everywhere after the sale.
The business was not struggling because demand was weak- it was struggling because one high-demand product quietly erased a portion of the gains made by every other category.
Recognizing this pattern allowed the company to take targeted action to correct the issue. Several operational improvements were introduced:
Table packaging was redesigned to better withstand delivery
A modest oversized-item surcharge was added to reflect true handling costs
Warehouse organization was adjusted to reduce movement and handling time
These adjustments helped the business align its operational costs with its revenue, restoring profit balance across the catalog.
The visualization ultimately highlighted a broader lesson:
A product can be popular, well-reviewed, and frequently purchased- yet still unprofitable if its hidden costs exceed what it brings in.
Revenue alone does not determine success. Understanding the full journey of a product, from warehouse to delivery, is essential for sustaining a healthy business.
Back in 2020, walking through Beirut felt different. The city that once overflowed with tourists, weekend travelers, and the constant shuffle of suitcase wheels had fallen unnervingly quiet. Streets that were normally alive with hotel valets, café chatter, and late-night crowds echoed instead with a stillness that was impossible to ignore. That silence was more than a mood—it was data waiting to be understood.
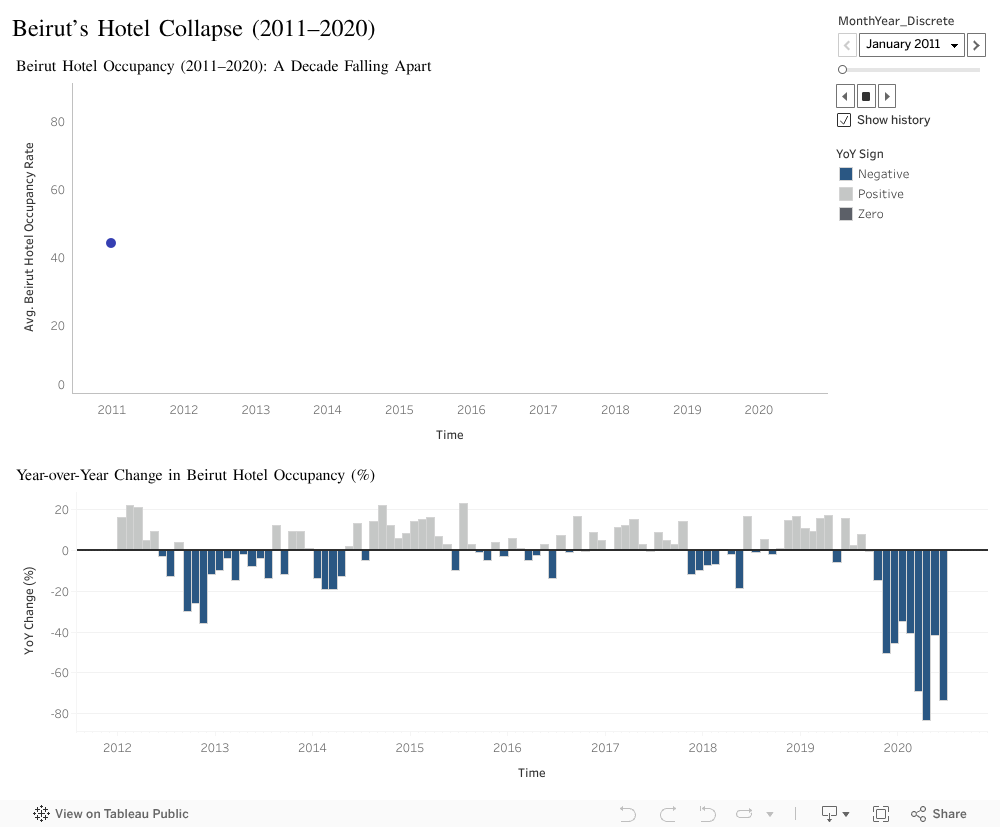
In this visualization, I retrace monthly hotel occupancy rates in Beirut from 2011 to the first half of 2020. For nearly a decade, the line moved in recognizable waves—seasonal peaks, predictable dips, and fluctuations shaped by politics, tourism cycles, and local instability. Despite everything Lebanon had endured, the hospitality sector kept finding its rhythm again.
But as the animation approaches late 2019 and early 2020, something shifts. The familiar pattern fractures. The line doesn’t simply decline—it collapses.
Watching the animation month by month feels almost like watching Beirut lose its breath in real time. In January 2020, occupancy was already strained. By March and April, the numbers didn’t just dip—they plummeted to historic lows. The hotels that once hosted conferences, weddings, and tourists from across the world were suddenly empty.
To make the scale of this collapse clearer, I use a second visualization: the year-over-year (YoY) change. For years, even amid disruptions, positive and negative bars balanced each other out—losses were recoverable, gains still appeared. But in 2019 and especially 2020, the bars plunge into deep negative territory. Some months show declines of more than 70%, marking the most severe contraction the sector had ever experienced.
This wasn’t a gradual decline. It was a cliff.
The causes were layered: the economic crisis accelerating through 2019, the nationwide protests, the currency collapse, and the early months of the COVID-19 pandemic. All these forces converged so quickly that a sector built over decades unraveled in mere weeks.
Seen animated, the data becomes a visual narrative of this unraveling—the rhythm of a city interrupted, its resilience stretched past its breaking point.
Big Idea:
What happened in 2020 was not a slowdown: it was a breaking point. The collapse of Beirut’s hotel occupancy reflects a sector that had survived everything until several crises finally hit at once. The data makes one message clear: when pressure builds over years, failure can arrive all at once, and without warning. Recovery has fortunately already begun, which makes it essential for policymakers to strengthen early-warning systems and support mechanisms so that the hospitality sector can withstand future shocks more effectively.