
by Nourhan Mahmassani | May 5, 2020 | Visualization
We all heard that Covid-19 pandemic lock down has some positive impacts on earth. We did a project studying the impacts of Covid-19 on stock market, healthcare sector, flights, and Pollution. The visualization below shows NO2 levels in different continents before and after Covid-19.There was a decrease of NO2 levels in some continents due to lockdown(the factories closing, less pollutants emissions from cars, flights, etc.)
by Nourhan Mahmassani | May 5, 2020 | Visualization
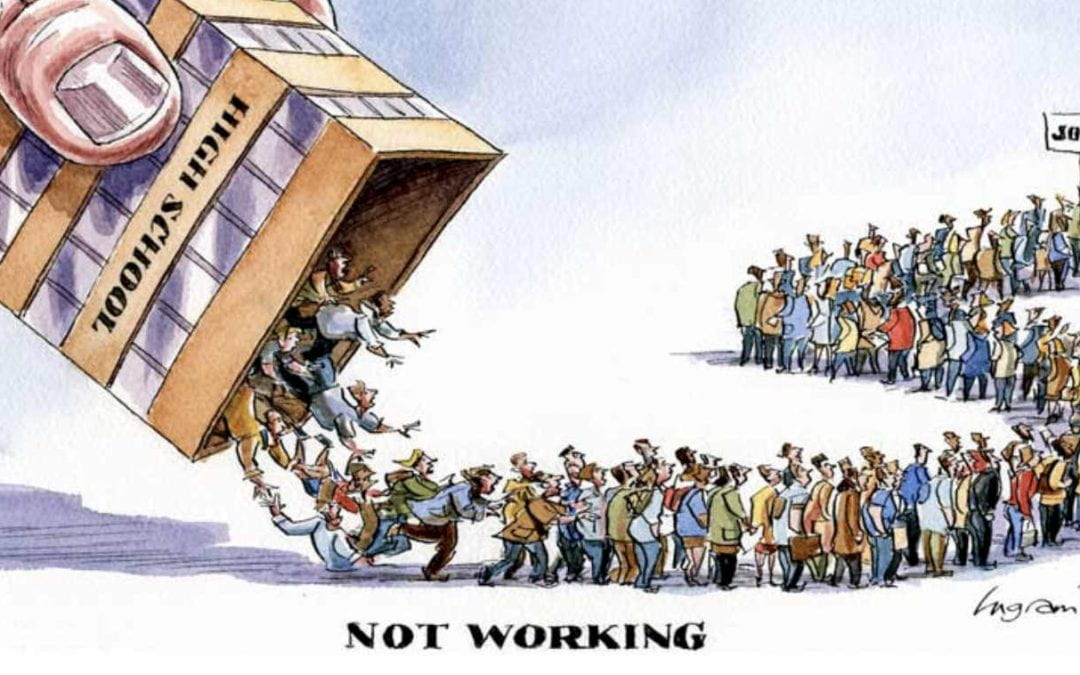
Countries face a huge loss due to unemployment. In order to find a solution for unemployment, we searched for the factors causing it. As shown below, gender discrimination, country’s GDP, distribution of jobs among the economic sectors, and educational level have a huge impact on Unemployment.Above,you can alter the regions you want to analyze from using multiple values drop-down.
In Conclusion:
-As GDP increase the Unemployment rate decrease
-Female Unemployment is higher than the males due to gender discrimination in workplace
-Employment rate is higher in the services sectors which mean that there is no equal job opportunities in between sectors causing higher
unemployment
-If the educational level is more advanced, their is lower unemployment rate
Data Source: https://datacatalog.worldbank.org/dataset/world-development-indicators