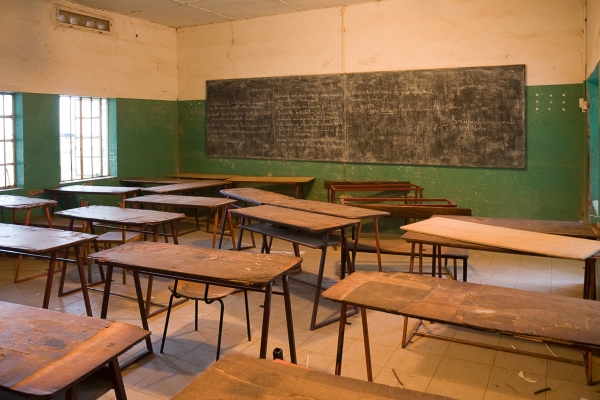
Where are all the Children?
“When children must split their time between fetching water and protecting their families’ greatest wealth, the livestock, their education suffers”
Marco Prates
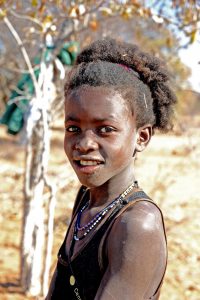
Marta Ndimaoshitya
Meet Marta Ndimaoshitya:
Marta is a 12-year-old educated girl. “Educated?”, You might say. “Then what’s the problem?”, you might wonder. Well, the problem isn’t with Marta, it’s with Marta’s 3 siblings who have dropped out of school because there is no water for them to undertake the long walk to reach the school. The only reason Marta is able to go to school is that it is close to her home. You might have thought of many reasons why they are unable to receive proper education, but I doubt this one would have crossed your mind. Unfortunately, many children around the world live a life similar to Marta’s siblings and even worse.
The below visualization will offer a clear sight of the countries that are suffering from children being out of school the most. I wish to shed light on these countries as the aim is not just to know the number of school dropouts, it is also to help solve the major factors that render this behind each specific country.
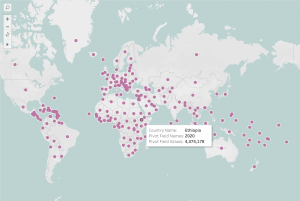
Countries like Libya, Nigeria, Chad, Ghana, and many more experience very high numbers of children out of school. Some of the factors that render this are poverty, gender inequality, child marriage, lack of access to clean water, and armed conflict.
Recommendations:
- Raise awareness on the importance of education
- Provide financial support for poor families
- Provide flexible, affordable, high-quality school options
- Improve the access to education