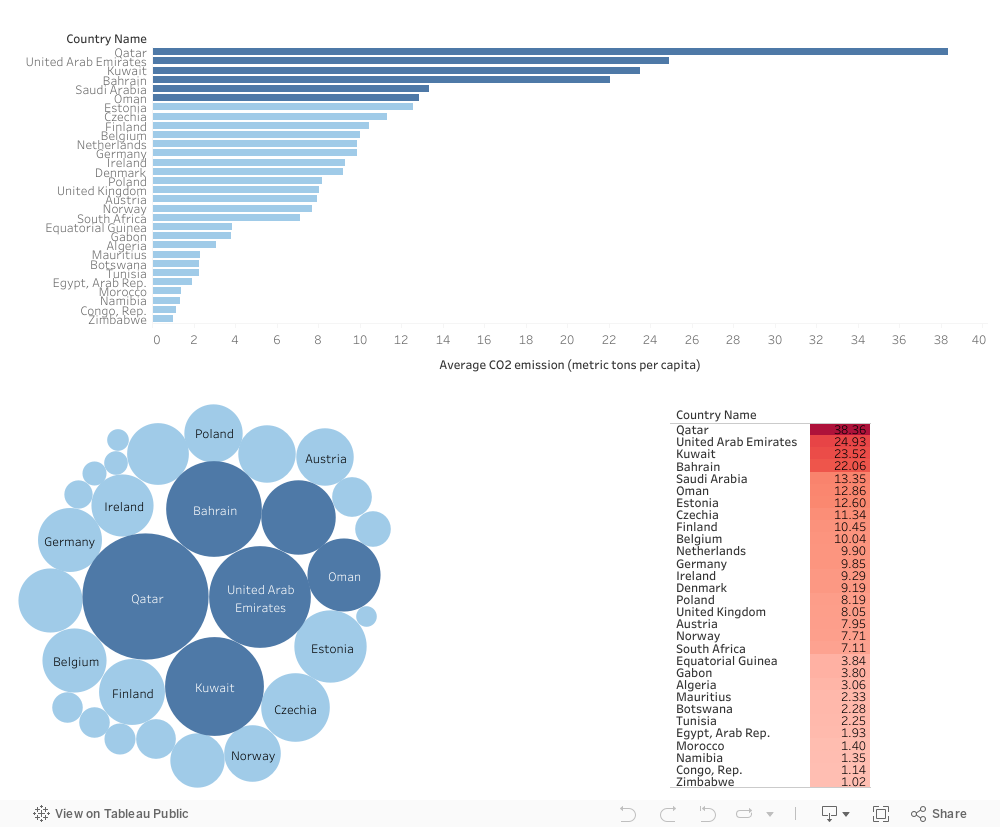
Climate change poses a global challenge that requires a comprehensive understanding of the disparities in CO2 emissions and their associated health impacts across different regions. In this analysis, we delve into the significant differences in CO2 emissions between Gulf countries, top European emitters, and top African emitters. By exploring the root causes of these disparities, we aim to develop actionable solutions that promote equitable emissions reduction and sustainable development.
A closer examination reveals that Gulf countries and top European emitters have experienced rapid economic growth, leading to high levels of CO2 emissions per capita. These regions have witnessed rapid industrialization and urbanization, fueled by industries heavily reliant on fossil fuel consumption, such as oil, gas, and manufacturing. In contrast, the less economically developed African nations face economic challenges and limited access to modern energy infrastructure, resulting in lower CO2 emissions.
To address these disparities and promote sustainable development, we recommend the following solutions:
Diversification of economy: Encourage Gulf countries to invest in non-oil sectors, such as renewable energy, technology, and sustainable industries. By reducing reliance on fossil fuels, these countries can lower their CO2 emissions and promote long-term economic diversification.
Sustainable agriculture and land use practices: Promote sustainable agricultural practices, such as agroforestry and efficient irrigation systems, to reduce emissions from land use change and agricultural activities. Encourage reforestation and afforestation initiatives to enhance carbon sequestration and biodiversity conservation.
Policy and regulatory frameworks: Develop and enforce robust policies and regulations at both national and international levels to promote emissions reductions, energy efficiency, and the adoption of renewable energy sources. This will create a conducive environment for sustainable practices.
Sustainable agriculture and land use practices: Promote sustainable agricultural practices, such as agroforestry and efficient irrigation systems, to reduce emissions from land use change and agricultural activities. Encourage reforestation and afforestation initiatives to enhance carbon sequestration and biodiversity conservation.
To empower change and ensure health resilience, we propose the following strategies:
Socio-economic factors: Address socio-economic disparities by promoting inclusive economic growth, reducing income inequality, and improving access to clean energy and sustainable development opportunities. This will create a more equitable foundation for emissions reduction efforts.
Health impact mitigation: Raise awareness about the adverse health effects of CO2 emissions and climate change to encourage behavioral changes. Strengthen healthcare systems and public health infrastructure to mitigate the health impacts, such as heat-related illnesses and respiratory diseases.
Clean energy transition: Promote the adoption of renewable energy sources, such as solar, wind, and hydroelectric power, in all three regions. Incentivize investments in clean energy infrastructure and technologies, especially in less economically developed nations.
Carbon capture and storage (CCUS) technologies: Invest in the development and deployment of CCUS technologies to capture and store CO2 emissions from industrial processes, particularly in oil and gas operations.
Public awareness and engagement: Raise public awareness about the impact of CO2 emissions on climate change and the importance of individual actions in reducing carbon footprints. Educational campaigns and community engagement can drive positive behavioral changes.
To ensure the effectiveness of these solutions, continuous monitoring of CO2 emissions is crucial. Regular evaluation and analysis of emissions data will provide insights into the impact of implemented initiatives. Key areas for monitoring and evaluation include:
– Tracking CO2 emissions and comparing them with baseline measurements to evaluate progress towards emissions reduction targets.
– Monitoring energy consumption data and evaluating the effectiveness of energy efficiency regulations and initiatives.
– Analyzing renewable energy capacity additions and generation data to assess the success of renewable energy deployment strategies.
– Monitoring the performance and environmental impact of CCUS projects, along with evaluations of their cost-effectiveness.
– Evaluating the socio-economic and environmental benefits of climate finance and investments in renewable energy projects.
By implementing these recommendations, we can bridge the emissions divide, promote sustainable development, and mitigate the adverse effects of climate change. Together, we can build a more equitable and sustainable future for all.
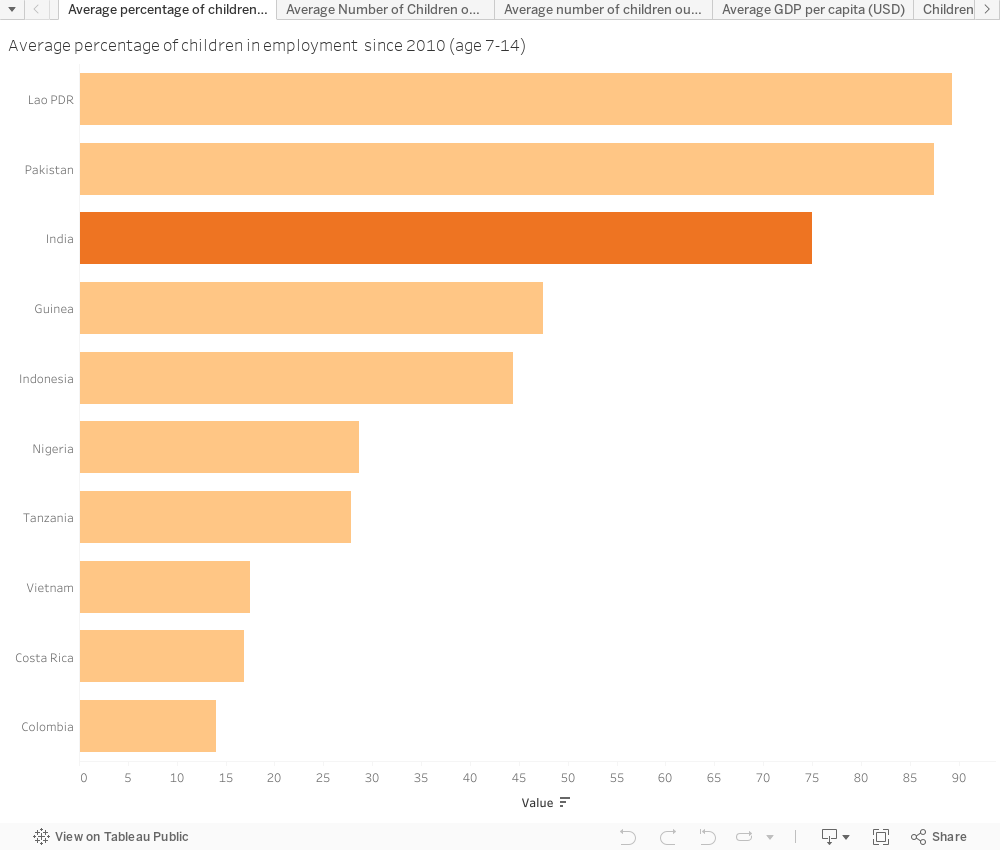
Arjun is a 12-year-old boy who lives in a small village in India. His family is very poor, and his parents cannot afford to send him to school. Instead, Arjun works in a nearby farm for long hours and for very little pay. He is often tired and sick, and he has no time to play or go to school.
Arjun’s story is not unique. Millions of children around the world are forced to work instead of going to school. This is especially true in developing countries like India. Child labor is a serious problem, and it has many negative consequences for children.
The data above shows the top countries with the highest percentage of child labor since 2010, with India ranking at the top 3. Children who work are more likely to be exposed to hazardous working conditions, which can put their health and safety at risk. Child labor can also lead to social problems, such as increased crime and violence.
The number of children out of school in India is a serious problem, and child labor is one of the main reasons why so many children are not able to get an education. Education is afundamental right and a key driver of development. It equips individuals with knowledge, skills, and critical thinking abilities necessary for personal growth, economic empowerment, and social progress. When a significant number of children are out of school, it hampers the overall development of a country, contributing in social instability and conflicts within societies.
The difference between the number of children out of school in Finland and India is a significant one. Finland actively works to eliminate child labor and uphold the rights of children to receive a quality education through its strong legal framework, commitment to equality, and collaboration with international organizations, ensuring a safe and nurturing environment for every child in the country. It has implemented comprehensive laws and regulations that strictly prohibit child labor and safeguard children’s well-being. Compulsory education ensures that all children have access to education, while teachers are highly trained professionals who create supportive and inclusive learning environments. As a result of these investments and initiatives, Finland has one of the lowest dropout rates in the world. Students in Finland are more likely to complete their education and pursue higher education or vocational training, leading to better career prospects and economic opportunities.
The difference in gross domestic product (GDP) per capita between Finland and India is a good example of the negative impact of child labor and children out of school.
There are several things that can be done to address child labor. These include:
• Providing free and compulsory education for all children.
• Raising the minimum legal working age.
• Enforcing child labor laws.
• Providing economic opportunities for families so that they do not need to rely on child labor.
• Raising awareness of the issue of child labor.
The story of Arjun and Finland shows that it is possible to address child labor. Child labor is a serious problem that has a number of negative consequences for both children and society as a whole. It is important to take steps to reduce child labor and ensure that all children have the opportunity to reach their full potential. By investing in social welfare, education, and enforcement, governments can help to reduce child labor to a very low level.
Our world faces an ongoing and formidable challenge with the relentless rise in energy demand, which is accompanied by an alarming increase in carbon emissions (CO2) and environmental degradation. Both factors have a profound impact on climate change and pollution and this is mainly due to the significant contribution of traditional energy sources. Thus, a crucial transition towards sustainable energy alternatives becomes imperative!
However, a critical question arises here: How can we measure the progress and effectiveness of this transition? That’s where our exploration of renewable energy consumption rate from the total energy across regions comes in. By examining this key metric, we can uncover insights into the pace and effectiveness of the shift towards sustainability.
The above visualization reveals significant disparities in the average rates of renewable energy consumption among the seven considered regions:
• Africa Western and Central stand out with an impressive average rate of 80.48%, closely followed by Africa Eastern and Southern at 62.57%.
• However, regions like North America, Europe & Central Asia, and East Asia & Pacific exhibit lower average rates, ranging from 8.56% to 28.27%.
• Unfortunately, the Arab World stands out with the lowest average rate of renewable energy consumption at 5.47%.
These disparities highlight the need to examine regional trends and identify areas for improvement.
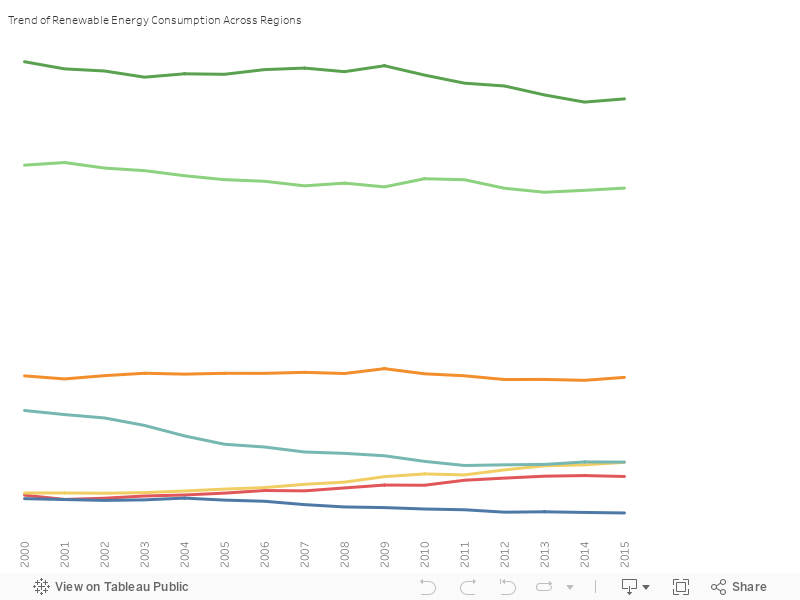
Additionally, the below line chart portrays the trends in renewable energy consumption from 2000 to 2015 provides further evidence:
• Regions like Africa Western and Central display a relatively steady trend, indicating a successful and consistent approach.
• Others, such as Africa Eastern and Southern, showcase a gradual decline followed by a stable trend.
• Meanwhile, regions like East Asia & Pacific, Europe & Central Asia, Latin America & Caribbean, North America, and the Arab World demonstrate varying levels of growth and fluctuations in renewable energy consumption over the years.
Based on the above analysis, we propose studying successful cases and embracing collective learning. This approach will allow us to develop comprehensive strategies for effectively adopting sustainable practices. By understanding specific policies, initiatives, and key factors driving regional success, we can replicate and adapt these strategies to other regions.
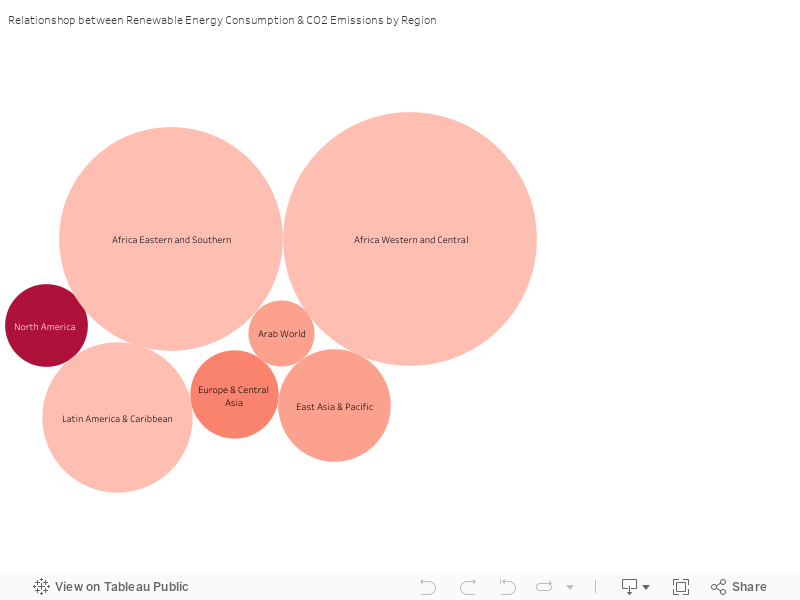
Validating the success of the implemented strategies by analyzing their potential outcomes, particularly in terms of reduced carbon and greenhouse gas emissions rates is a must. Visualizing the relationship between renewable energy consumption and CO2 emissions using a Bubble Chart further confirms the importance of renewable energy adoption. Regions with higher average rates of consumption tend to exhibit lower CO2 emissions.
In conclusion, we recommend to accelerate the transition to renewable energy sources and promote sustainable energy adoption by:
• Increasing the efforts in alignment with the country’s economic and technological potentials.
• Continuous tracking and evaluation of renewable energy consumption and CO2 emissions rates are essential to assess the effectiveness of the implemented solutions.
• Regions with lower rates of renewable energy consumption can learn from successful models, like Africa Western and Central, to enhance their strategies and promote sustainable energy adoption.
The Lebanese government is facing a decline in its global ranking of governmental effectiveness due to political and economic turbulence. This turbulence significantly impacts various aspects of governance, as measured by the Government Effectiveness Index developed by the World Bank Group. The study examines the relationship between the government effectiveness index, government expenditures, and inflation rate among Middle East Arab countries, including Lebanon, to provide a comparative analysis.
An analysis of the Lebanese Government Effectiveness Index reveals a consistent decline over time. Starting at a value of 40 in 2003, the index steadily decreases, reaching a concerning low of 3.85 in 2021. The graph visually illustrates this collapse, coinciding with the peak of political challenges and an economic collapse in 2015 and the Syrian civil war in 2011. The inflation and government expenditure indexes follow a similar path, indicating the interdependence of governmental effectiveness and various aspects of the economy. For instance, the inflation rate remained steady below 10% until 2018, where it sharply rose to 150%. Similarly, the government expenditure index, averaging above 12% before 2018, experienced a steep decline below 2% at 2021.
To elevate the ranking of Lebanese governmental effectiveness, it is imperative to address the underlying issues stemming from political, security and economic turbulence. These targeted measures should be implemented internally, acknowledging that the challenges primarily originate from internal factors rather than external ones. By conducting a comparative analysis with surrounding Arab Mediterranean countries that have faced more severe political and security challenges, such as the Arab Spring in 2013, which had a profound impact on their governance systems, we can glean valuable insights. For instance, Tunisia, with a comparable population and political system, witnessed a decline in governmental effectiveness indexes from 43% in 2013 to 33% in 2021. Similarly, when examining Morocco, we observe a decline in governance from 42% in 2013 to 35% in 2021. Nevertheless, both governments managed to maintain expenditures, thereby avoiding significant inflation. These comparisons underscore the potential impact of addressing internal challenges and provide valuable lessons for enhancing Lebanese governmental effectiveness.
To tackle political turbulence, it is essential to foster political stability through consensus-building and the establishment of effective governance structures. Additionally, addressing economic stability necessitates the implementation of reforms that target inflation, unemployment, and economic instability while managing expenditures. Enhancing public service delivery, strengthening the civil service, and promoting transparency and accountability in policy formulation and implementation are key components of the solution. To achieve this, it is crucial to foster economic resilience that can withstand the impact of political and security factors. Thank you for your attention.
The effectiveness of the proposed solution can be validated by monitoring the changes in the Government Effectiveness Index over time. As measures are implemented, improvements in the ranking will indicate progress in governmental effectiveness. This will positively impact overall country indexes, enable increased government expenditures, attract investments, boost the economy, and reduce the inflation rate.
Based on the analysis, it is evident that political, security and economic turbulence significantly impact the global ranking of Lebanese governmental effectiveness. To address this issue, it is recommended to foster political stability, implement economic reforms, enhance public service delivery, strengthen the civil service, and promote transparency and accountability. These recommendations aim to improve governance, create a more stable and effective government, and benefit the Lebanese people. Additionally, these actions will have a positive impact on the overall country indexes, allowing for increased government expenditures, attracting investments, boosting the economy, and reducing the inflation rate.
In late 2019, the world was hit by the emergence of COVID-19, a highly infectious disease originating in Wuhan, China. Initially underestimated, the virus rapidly spread globally, putting immense strain on healthcare systems worldwide.
Let’s analyze the impact of COVID-19 by delving into the numbers. Globally, the number of confirmed cases rose from 82 million in 2020 to 444 million in 2022, with a similar trend seen in the number of deaths. By examining a map, we can observe the percentage of deaths in relation to confirmed cases for each country. Additionally, a bar chart displays the top 10 countries with the highest confirmed cases and deaths. For example, the United States (USA) stands out with the highest number of confirmed cases, but surprisingly, its percentage of deaths is relatively low at 1%. This can be attributed to the country’s strong healthcare system, which has likely contributed to better outcomes. Similar analyses can be conducted for other countries, allowing us to gain insights into the relationship between confirmed cases, deaths, and the strength of healthcare systems.
To combat its spread, governments implemented various measures such as travel restrictions, quarantines, and social distancing guidelines. These measures had significant implications for the economy, international trade, and transportation. For instance, the annual GDP growth experienced a sharp decline from 700 in 2019 to a staggering -1121 in 2020, indicating a 260% decrease. Similarly, the indicator for imports and exports of goods and services witnessed a decline of 539% in 2020, while air travel passenger numbers plummeted by 140%, representing a decrease of 22 billion passengers.
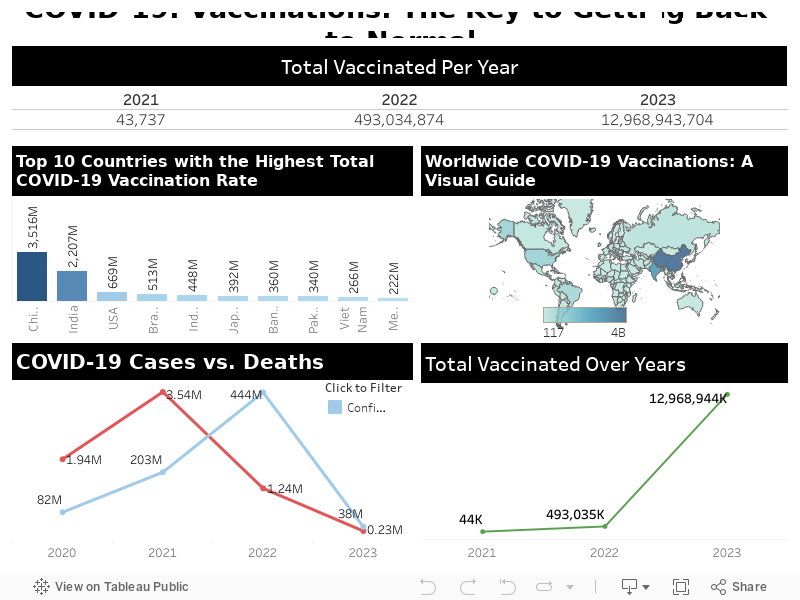
Nurturing Hope: The Transformative Power of Vaccines in the Fight Against COVID-19
In response to the pandemic, pharmaceutical companies dedicated extensive research efforts to develop effective treatments and vaccines. Their successful launch of the COVID-19 vaccine in December 2020 brought a sense of hope, aiming to control the spread of the virus and mitigate its impact on public health. This vaccine demonstrated a remarkable efficacy rate of over 90%, effectively preventing symptomatic COVID-19 infections. As we delve into the numbers, the data reveals a significant increase in the number of vaccinated individuals, rising from 44,000 in 2021 to an astounding 13 billion in 2023. A map visualization showcases the total number of vaccinated individuals in each country. The year 2022 became a turning point, with the total number of confirmed cases and deaths experiencing a downturn, while the number of vaccinated individuals continued to rise. By 2023, the confirmed cases decreased from 444 million to 38 million, and deaths reduced from 1.24 million to 0.23 million. With the vaccine’s proven effectiveness, governments began to ease restrictions, leading to a noteworthy improvement in various indicators by the end of 2021. These developments demonstrate the positive impact of the vaccine and how it has contributed to a decline in COVID-19 cases and deaths, alongside the significant increase in vaccinated individuals.
In conclusion, the positive progress gives us hope, and our recommendation is to urge pharmaceutical companies to continue their research and expansion efforts. This involves not only developing effective treatments in conjunction with vaccines but also emphasizing the importance of vaccine education. By embracing a comprehensive approach, we can successfully combat the virus and proactively mitigate the risk of future outbreaks.
Reference:
WHO Vaccination data: https://covid19.who.int/who-data/vaccination-data.csv
Daily Cases and deaths by date reported to WHO: https://covid19.who.int/WHO-COVID-19-global-data.csv
World bank: World Development Indicators: https://datacatalog.worldbank.org/search/dataset/0037712