
How often do we hear about our planet’s environmental crises but how rarely do we witness any sort of actions implemented to tackle this issue!
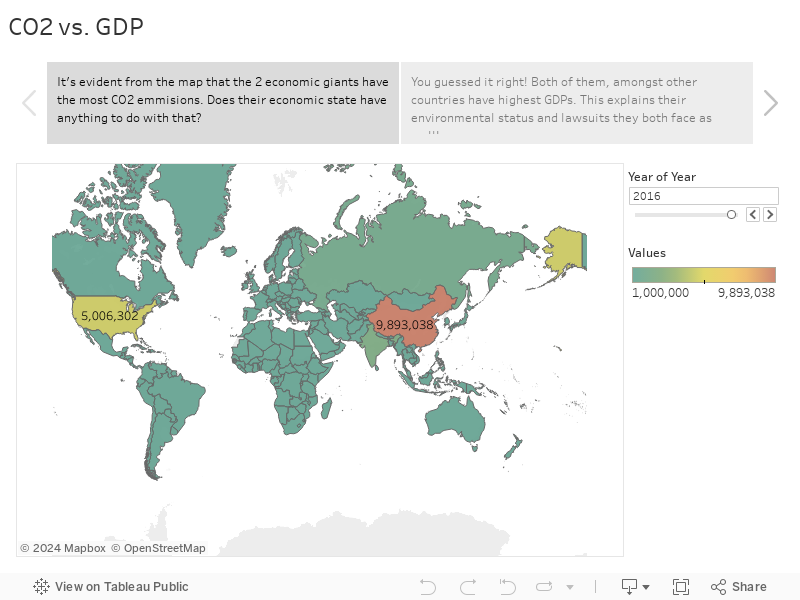
Who are the largest contributors to CO2 emissions hence deteriorating our environment?
What do these contributors share in common?
As Greta Thunberg stated ‘ Our so-called “role models” indeed have some work to do. It’s pretty hard to SOLVE the climate crisis without addressing these elephants in the room.
Let’s explore the largest contributors and what they share in common.
0 Comments